Net sales grew 9.2% in two years. Three
bridges split that into volume, mix, list price, discount and cost,
product by product, and the factors add up to the cent.
This one runs on a
generated file, not a real extract, and every dollar below is the
generator's rather than a business result. It is here to show the
method: the walk order, the drills, and the reconciliation. The
arithmetic is the deliverable, not the findings.
Margin moved, and everyone in the room
had a theory. A bridge replaces the theories with named causes: what
volume did, what the blend of products did, what list prices earned,
what discounts gave back, what cost took. I ran that walk three
times, on sales, on margin dollars and on the margin rate, split
every factor down to the product, then rebuilt the whole thing by
hand in a plain Excel workbook. The engine and the workbook agree to
the cent.
What I did+
Fixed the order of the walk once, volume, then mix, then price
split into list and discount, then cost, and stated it on every
page, because changing the order changes the split.
Took every factor down to product level, with the mix
contributions centred on the book average. Without that adjustment the total is still right, but half the products get the wrong sign: a cheap product gaining share looks like a mix winner while it is actually dragging the average down.
Reconciled everything that can be reconciled: factors to the
total change, list plus discount to price, every product list to
its factor, and the walk to the accounts.
Rebuilt all three bridges by hand in Excel, SUMIFS on the raw
rows, every formula live and inspectable, and matched the engine
to the cent. The workbook ships with the study.
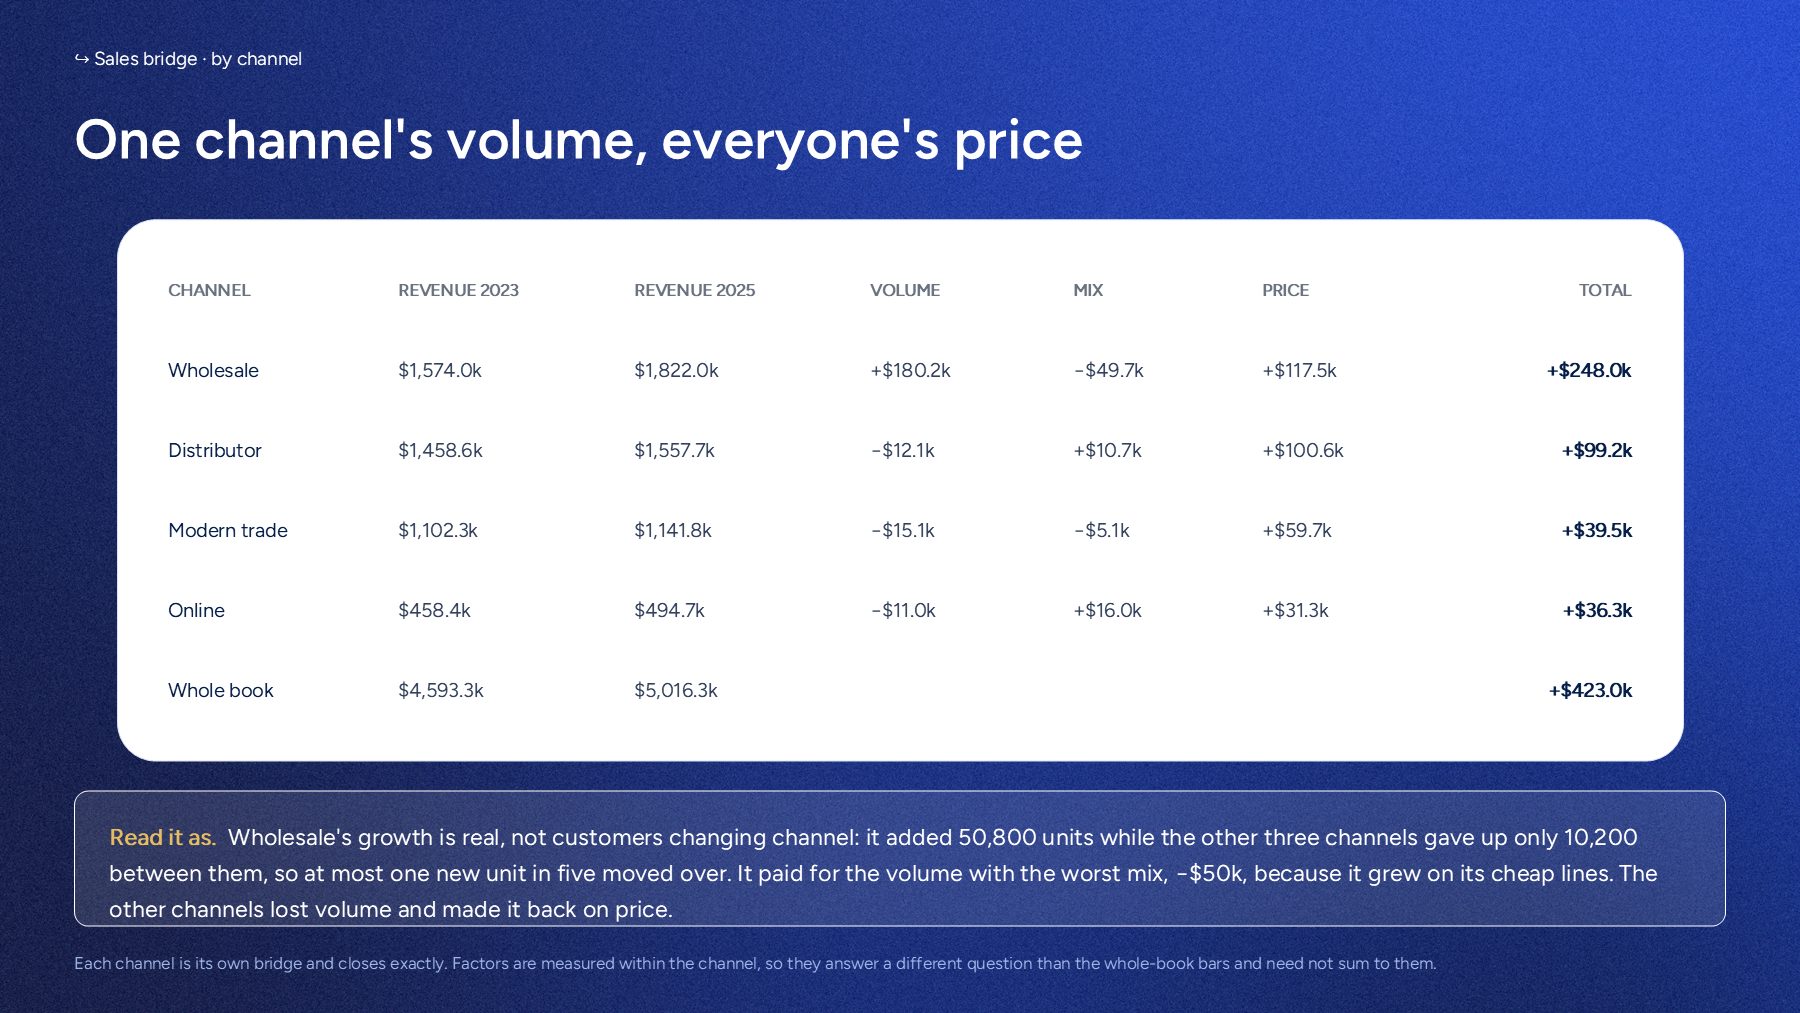
Cut the sales bridge by channel and by country as well as by
product: one channel carried all the volume growth, and paid for
it with the worst mix.
Chapter 01
The method: a chain, walked in a fixed order
Each factor answers one question: what would have happened if only
this had changed? The steps form a chain, every factor is measured
with everything before it already moved, so they sum exactly to the
change and nothing is counted twice.
01
Volume first
Let total units grow, everything else held at 2023: same prices,
same blend. One number for the whole book, the money earned just by selling more units, before looking at which products those units were.
volume = (units25 ÷ units23 − 1) × revenue23
02
Then mix
Same total units, but the blend shifts, still valued at 2023
prices. Products taking share count their gap to the average, so a
cheap line growing drags mix down even while its own units rise.
With units and blend in place, each product's own price moves to
its 2025 level, on its 2025 units. Split into list, the shelf move,
and discount, the part given back. List plus discount equals price
to the cent.
price = Σ (price25 − price23) × own qty25
list + discount = price
04
Then cost, margin only
Last, unit costs move to 2025, again on 2025 units, with a minus
sign. The sales bridge stops before this bar; the margin bridge
ends on it.
cost = −Σ (unit cost25 − unit cost23) × own qty25
Why 2023 weights and not 2025. Volume and mix are valued at
prior-year prices because their question is what the old book would
have earned; price and cost land on current-year units because that is
where a price move actually cashes. Walk it in another order, or from
the other end, and the split shifts while the total stays, and both
versions are defensible. What is not defensible is hiding the choice,
so the order and the base year are fixed once and printed on every
page.
The suffixes 23 and 25 mean the 2023 and the
2025 value. "Share" is a product's share of total units, or of revenue
on the rate bridge. "Own qty25" is that product's own 2025 units;
"units25" is the whole book's. Every line was rebuilt in Excel from
the raw rows and matched to the engine to the cent.
Chapter 02
The same walk, run on sales and then on margin
One decomposition, two questions. On sales: was the growth earned by
price or bought by volume? On margin: how much of the price gain
survived the cost inflation that came with it?
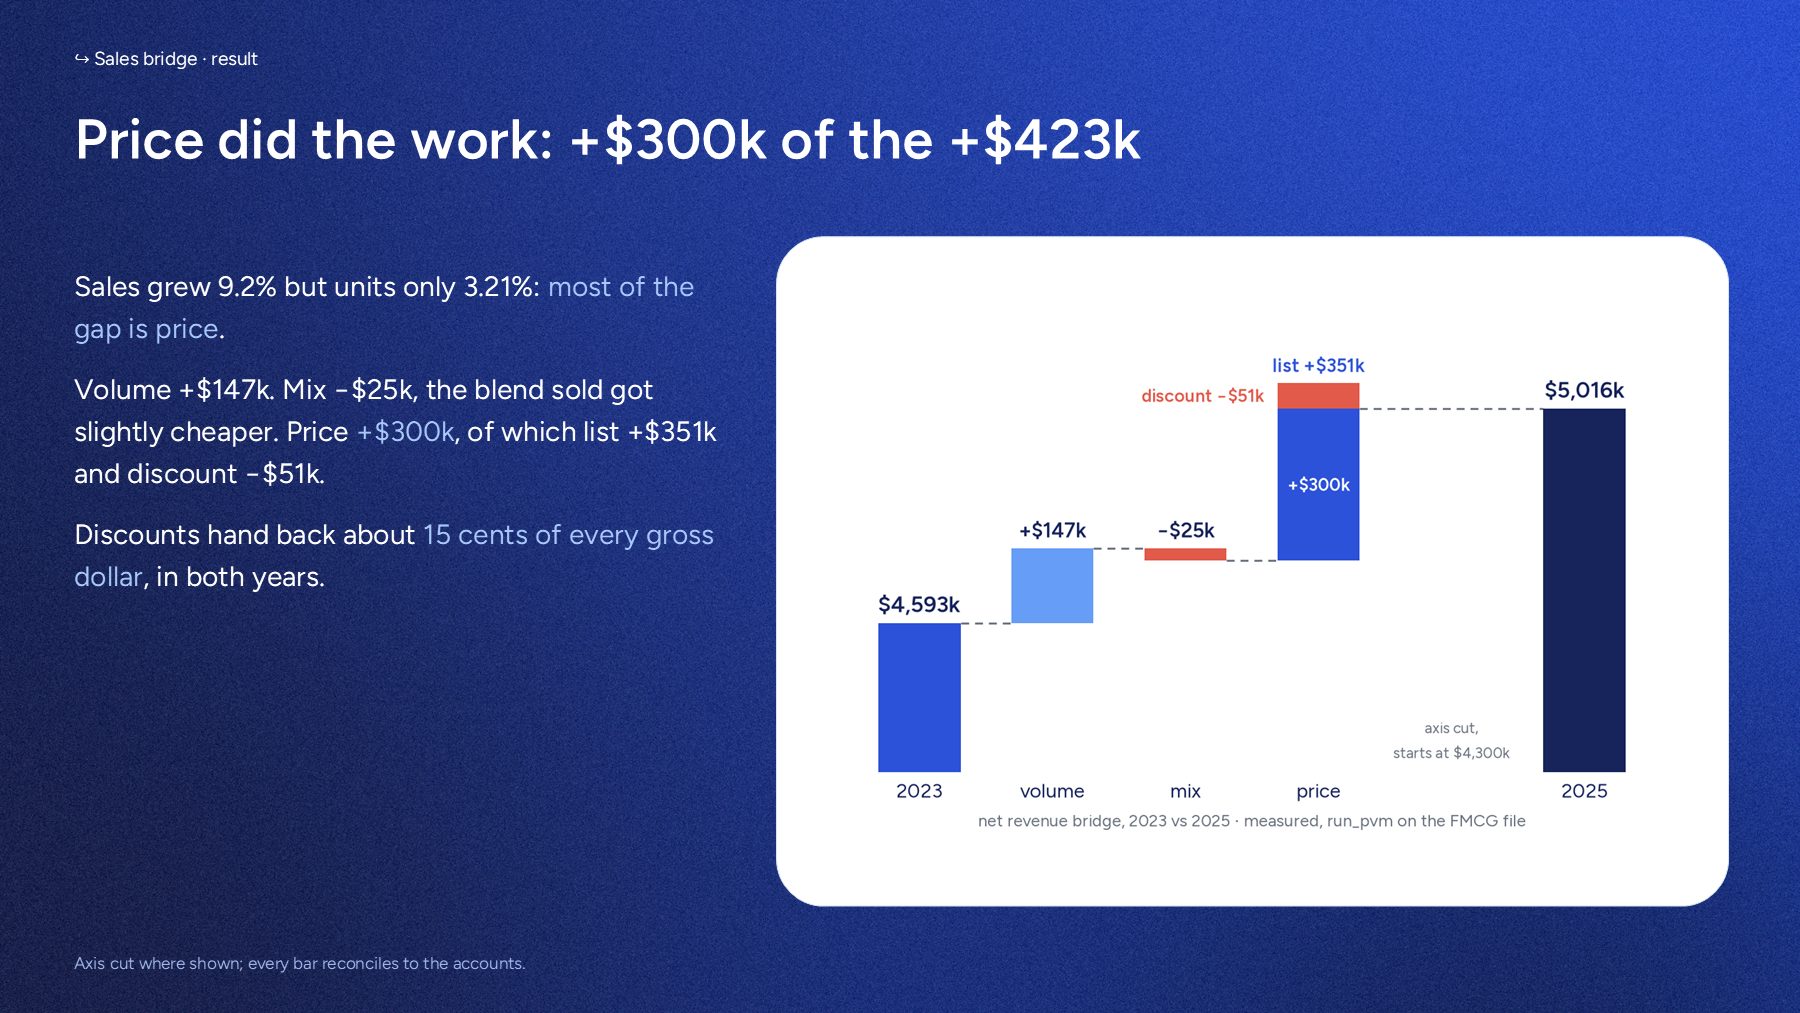
Price did the work. Sales grew 9.2% but units only
3.21%. Volume added $147k, the blend got slightly cheaper at −$25k,
and price added $300k, of which discounts gave $51k back.
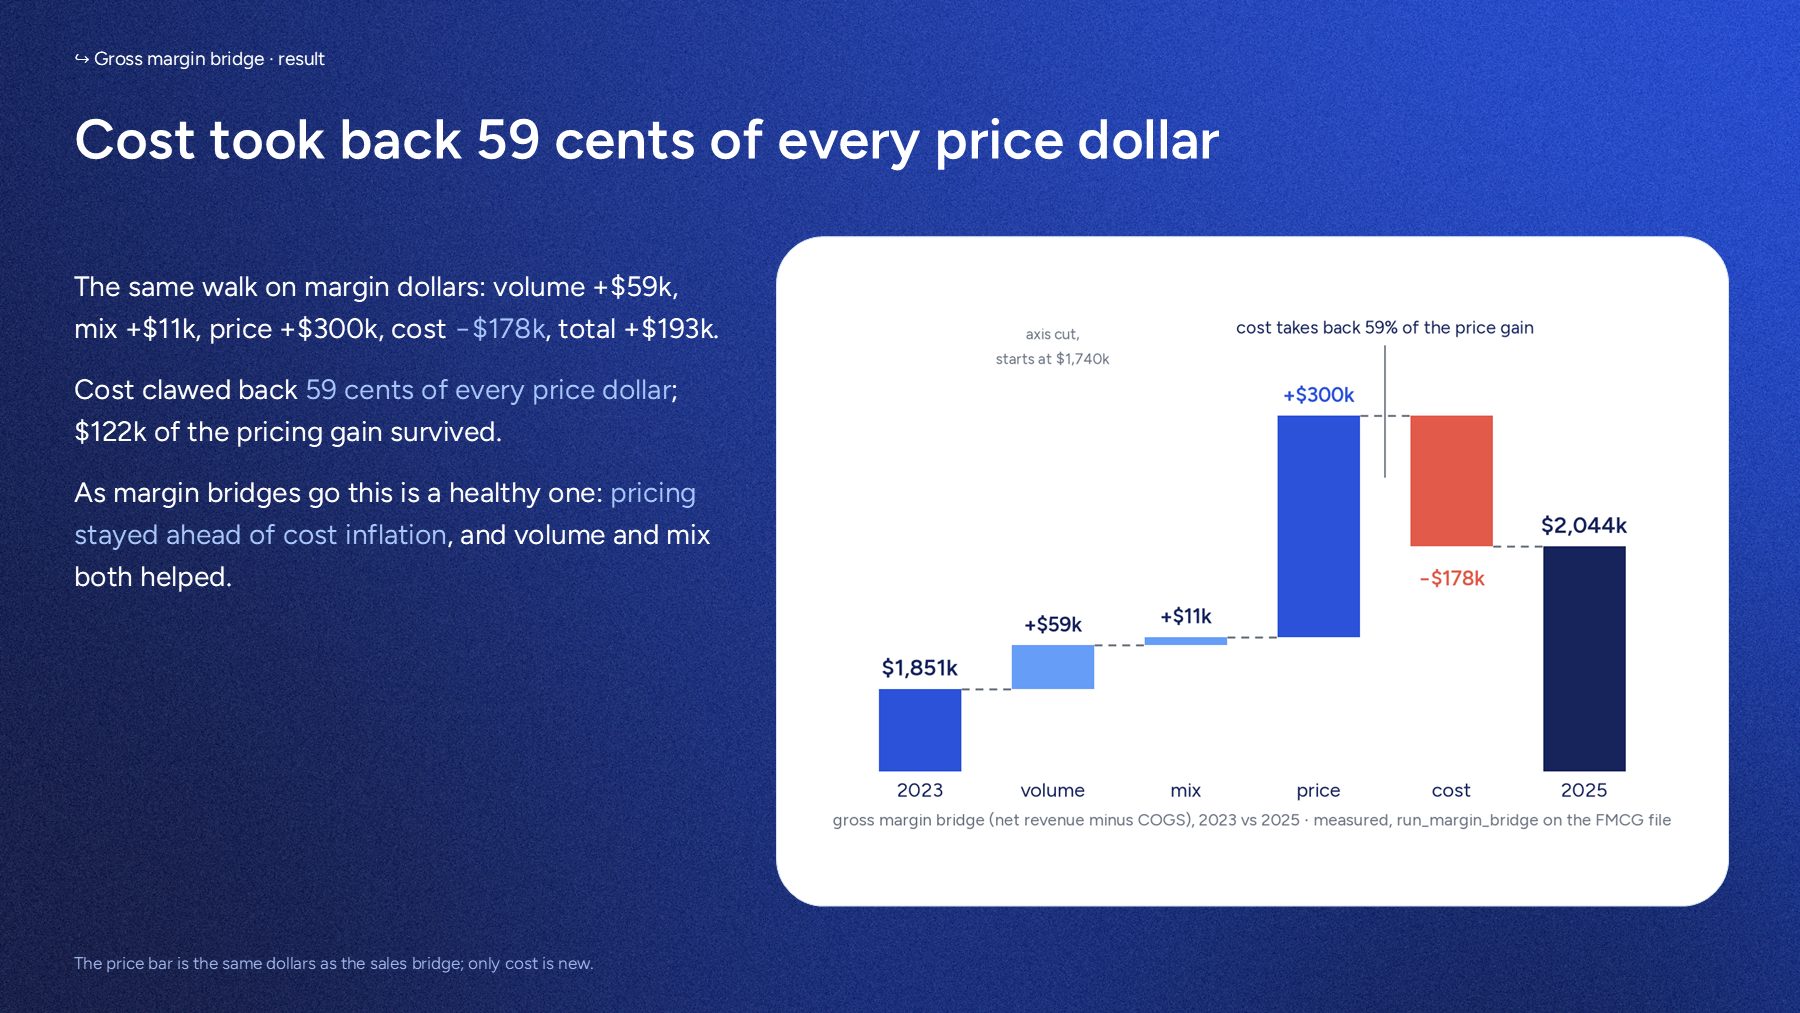
Then cost takes its share. The same +$300k of price
becomes +$122k of margin once cost of goods is paid. Pricing stayed
ahead of inflation, which is the healthy version of this
chart.
Chapter 03
Then every factor is opened to the products inside it
A factor total is where the argument starts, not where it ends. Each
bar splits into the products that carry it, and the two big bars turn
out to have opposite shapes.
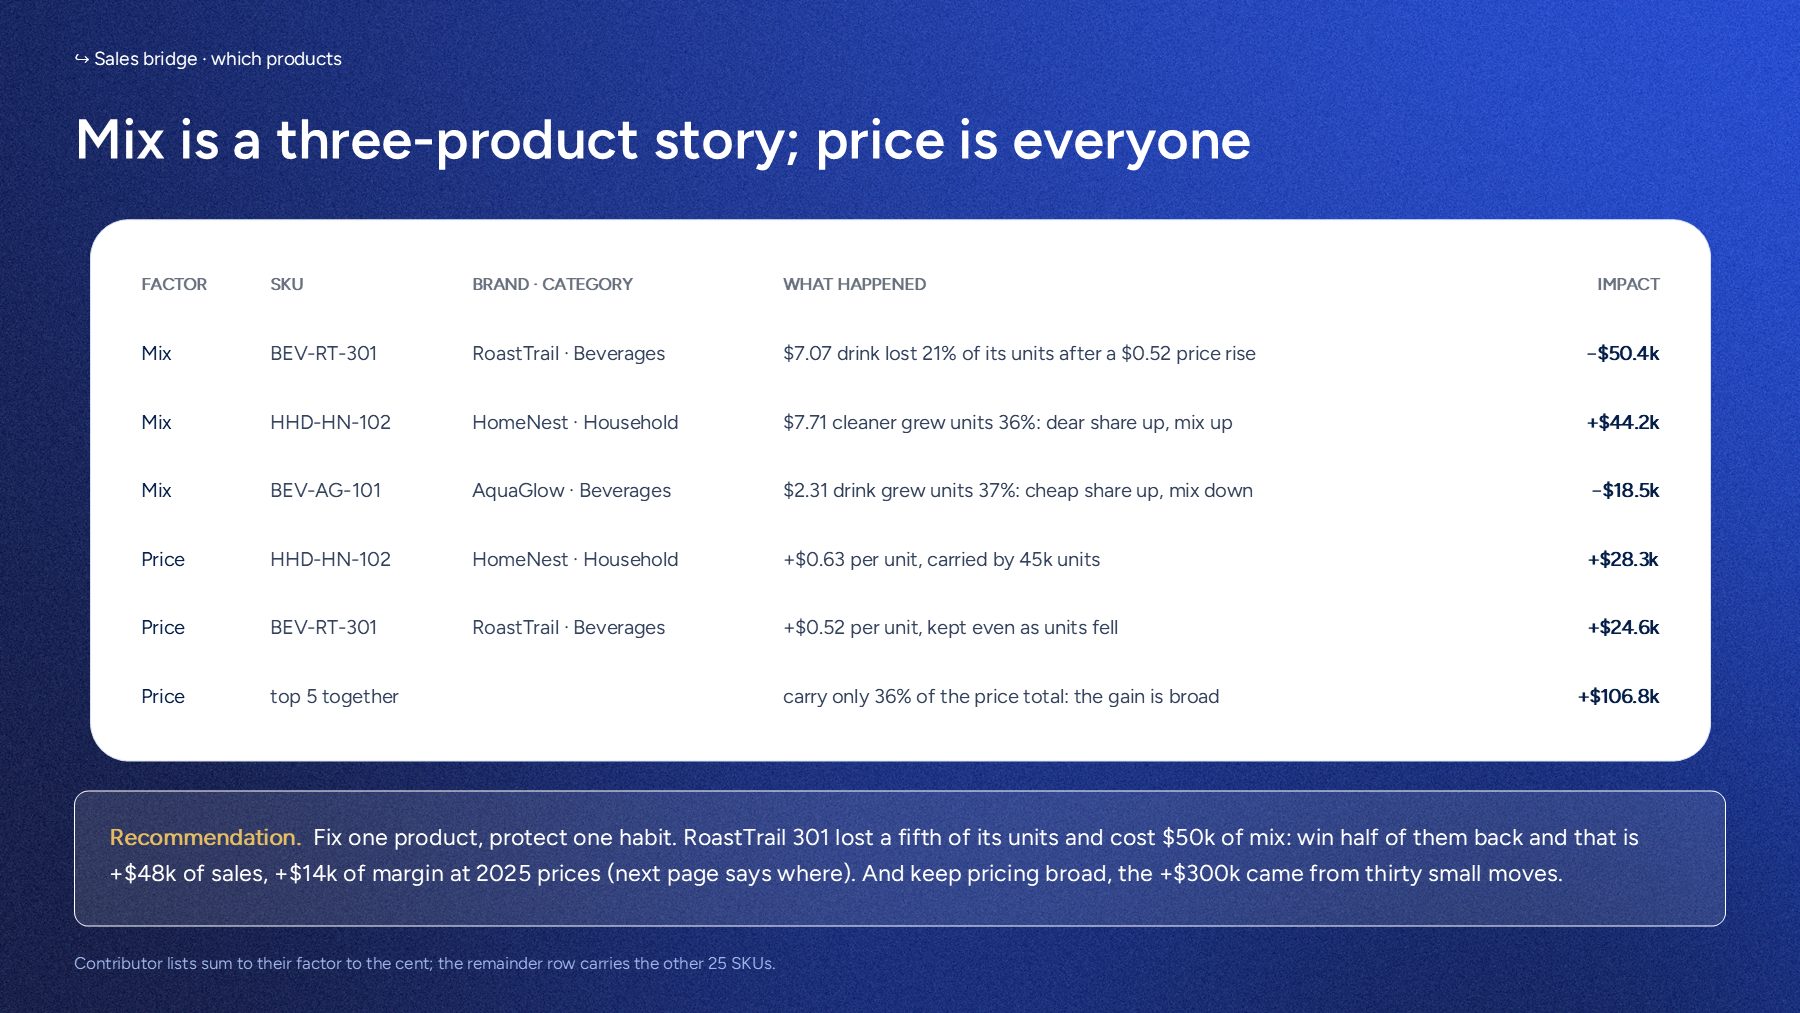
Mix is concentrated, price is broad. One $7 drink
losing a fifth of its volume cost $50k of mix on its own. The $300k
of price came from thirty small moves, the top five carry only
36%.
Then the same bridge by channel. Wholesale carried all the unit growth and paid for it with the worst mix, because it grew on its cheap lines. The other three channels lost volume and made it
back on price.
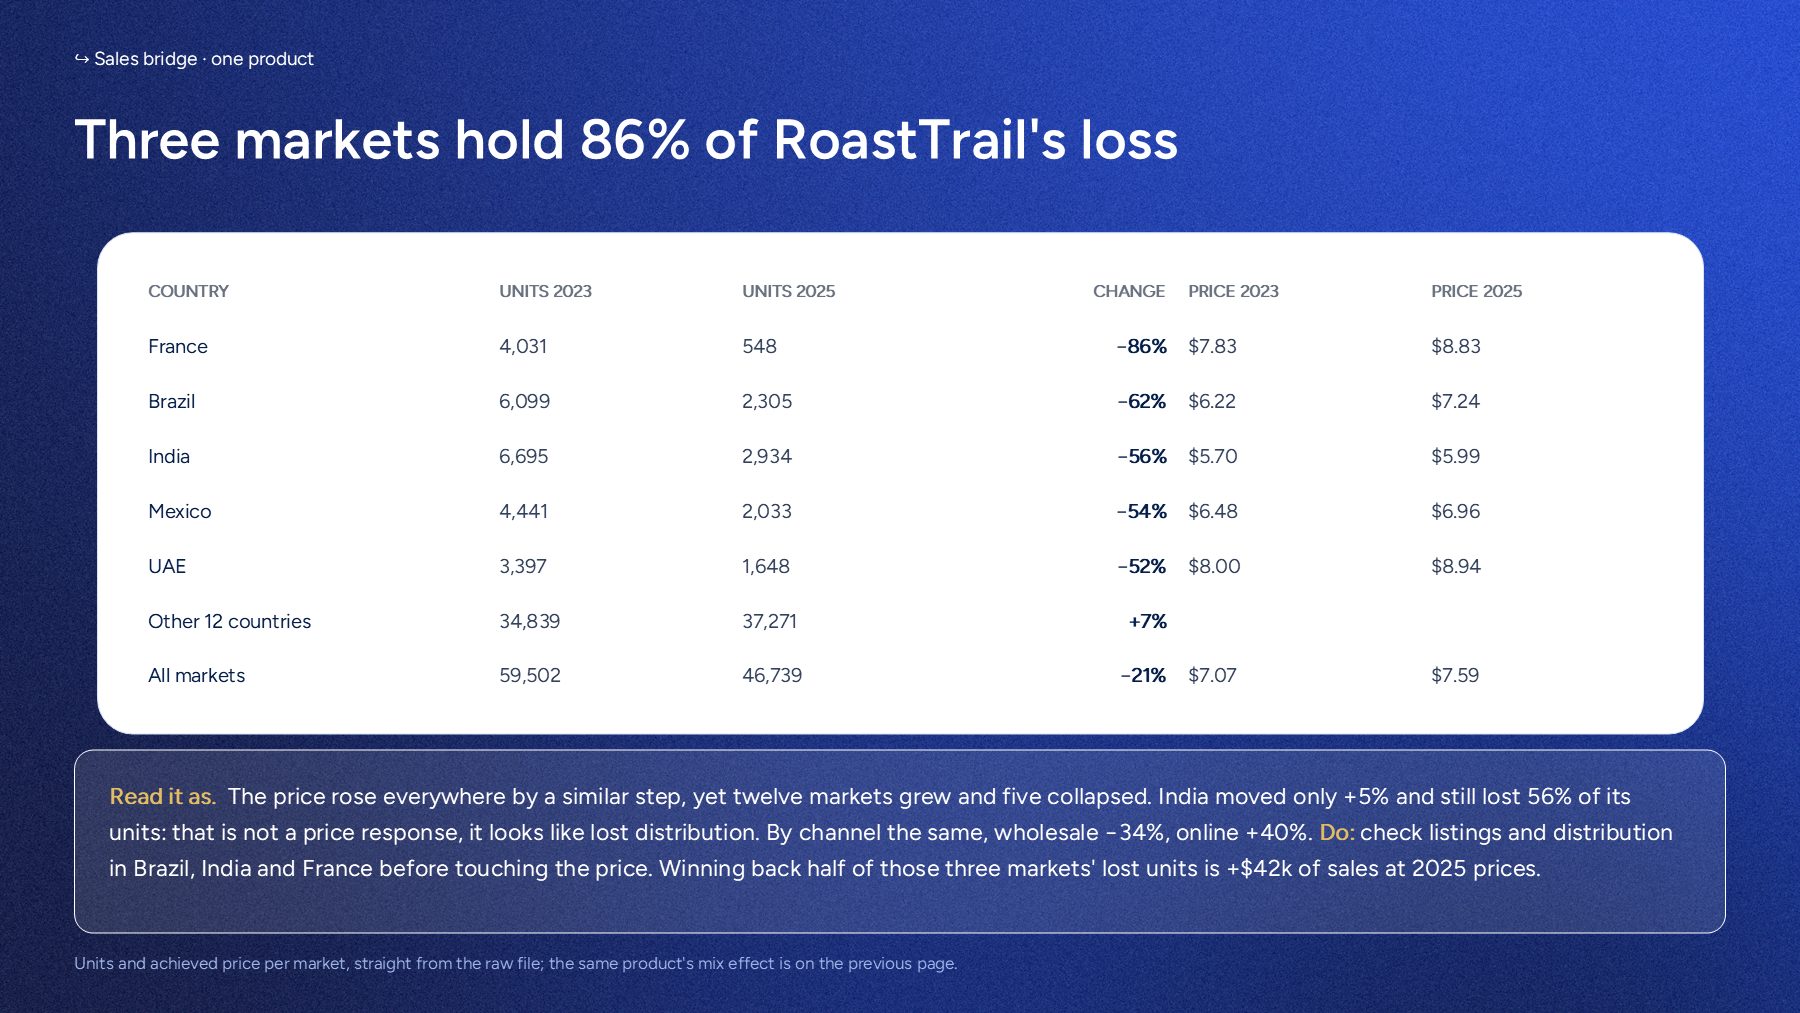
Then one product, market by market. The price rose
by a similar step everywhere, yet twelve markets grew and five
collapsed. India moved only +5% and lost 56% of its units: that is
not a price response, it looks like lost distribution. Winning back half of the three worst markets is worth +$42k of sales.
Why the per-product split needs care. The naive formula for a
product's mix contribution gives the right total and the wrong products:
anything cheap that grew reads positive. Centring each product against
the book average fixes the signs without moving the total, and the deck
states the convention it uses.
Chapter 04
The rate bridge tells the opposite story, on purpose
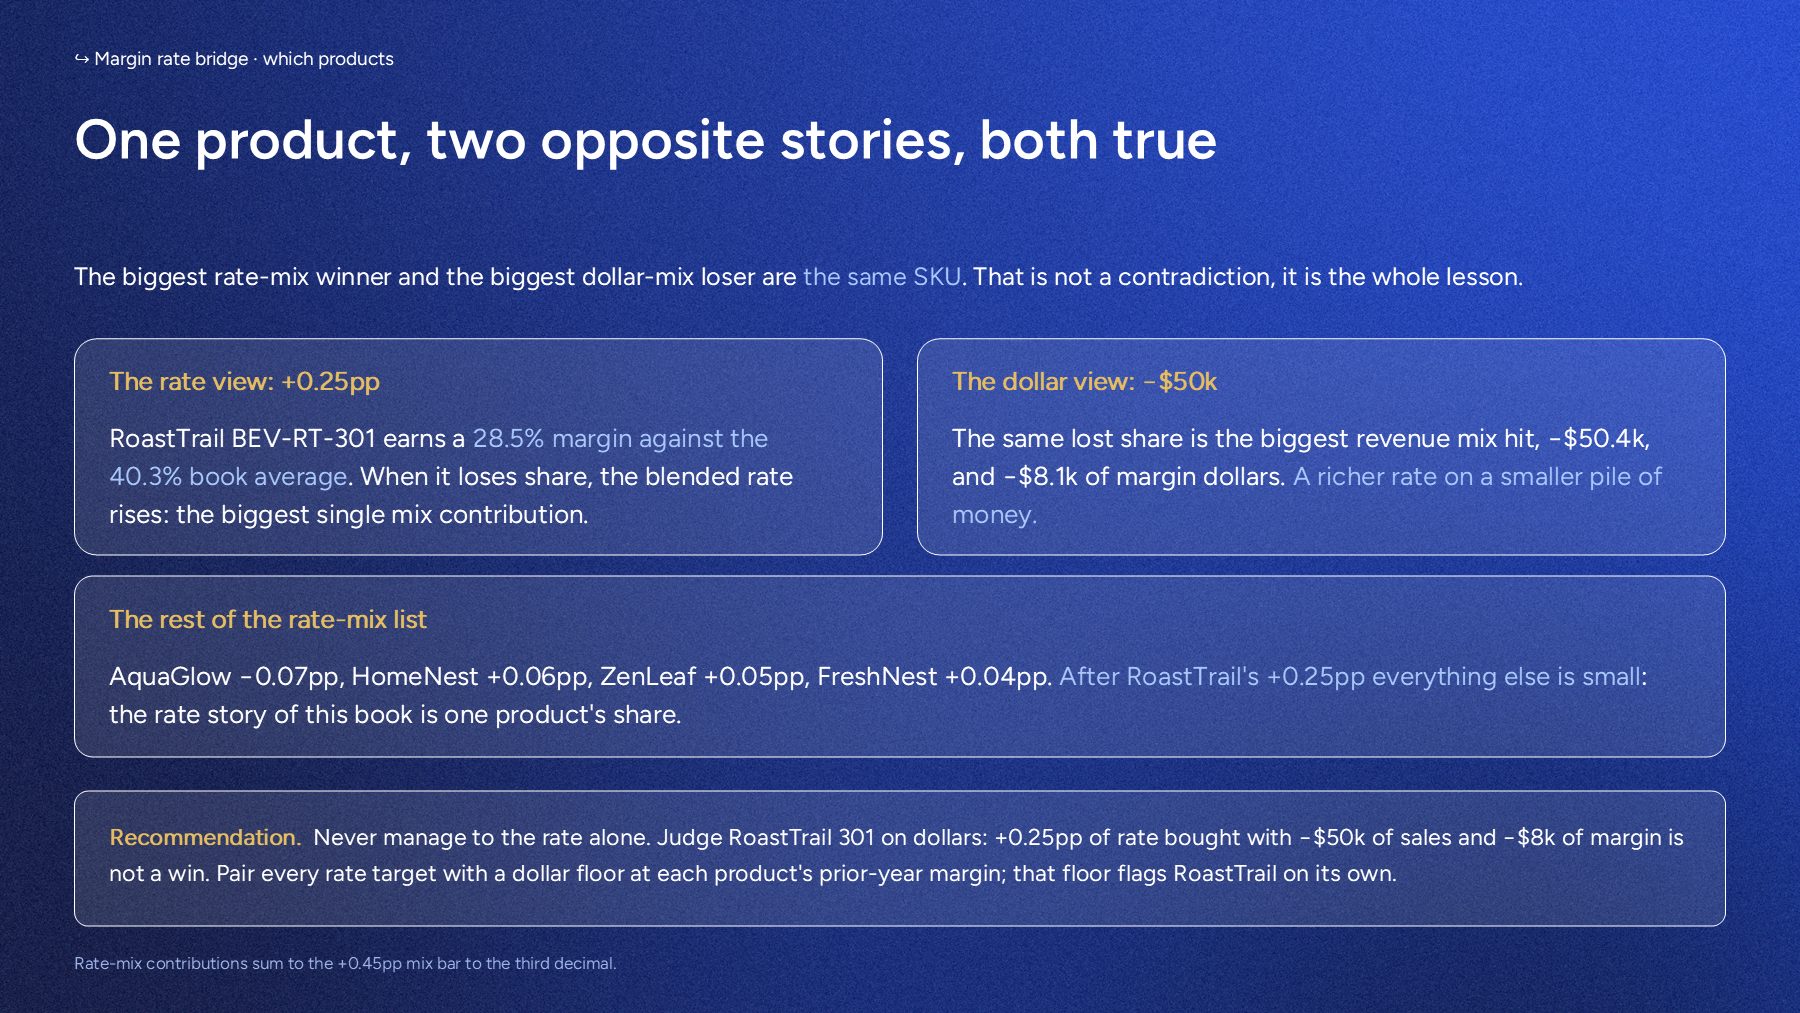
The margin percentage rose 0.45 points. The product that did most to
lift it is the same product that cost the most money. Both readings
are correct, and only the dollar reading tells you what the business earned.
One product, two opposite stories. A 28.5% margin
drink losing share lifts the blended rate by +0.25pp, and walks $50k of
revenue out of the door while doing it. A better percentage on less money.
Never manage to the rate alone. A rate target rewards killing
cheap volume. The study's recommendation is structural: pair every rate
goal with a dollar floor, and judge any product's fate on the money, not
the percentage.
Chapter 05
What this cannot tell you
Stated here rather than left to be found.
Cost was generated from price
In this file unit cost tracks unit price at a correlation of 0.87
to 0.92 within each product, which is the signature of cost being
derived from price rather than measured. So the price and cost bars
cancel in the rate bridge, and no margin-rate movement here can be
attributed to pricing. On a real file that question is open, and it
belongs to the pricing study.
How detailed a cut you take is a choice
Product by year is the headline. Product by channel, or by channel
and country, gives a different mix number, and all of them are
honest. The study states which cut it used and shows the others. It does not pretend there is one true mix number.
A bridge is not a cause
It says what moved, exactly and to the cent. It does not say why,
and it cannot say what would have happened otherwise. The why is the
pricing and promotion studies, which is the point of running them
together.
Reflection
What this study taught me
1. The total can be right while every product is wrong.
The naive per-product mix split sums perfectly and misstates half
the signs. Nothing in the arithmetic warns you, because the errors
cancel by construction. The lesson generalises: a decomposition that
adds up has proved its consistency, and a split that adds up has only proved that it adds up. It can still put the wrong sign on half the products.
2. One product can win the rate and lose the money.
The biggest contributor to the rate improvement and the biggest
destroyer of revenue were the same product. Any KPI that averages a
ratio will sometimes reward shrinking the denominator, so a rate
target without a dollar floor is an instruction to kill cheap
volume, whether anyone meant it or not.
3. The grain is part of the answer.
Mix at product level and mix at product-by-channel level are
different numbers, and both are correct. Two analysts can fight for
a week over a disagreement that is entirely a grain choice neither
wrote down. Printing the grain on the page costs one line and ends
the fight before it starts.
4. The hand check finds what the test suite cannot.
The engine's tests all passed while the per-product signs were
wrong, because the tests checked the totals. Rebuilding the bridge
in a spreadsheet, where every intermediate number is visible,
is slower than a test and catches a different class of error. The workbook is not an extra. It is how the numbers get checked.
Interested in what your data can support?
Start with the question, not a proposal. If your export
cannot support the study you had in mind, that is worth knowing in
twenty minutes.
Ask what your data can support
No system access, no IT project, one export
Signed engagement letter and data processing agreement