Drugstore chain, 1,115 shops·2026·Forecast audit, time series
Can you trust the number in the budget?
Almost every finance team builds it the
same way: the same week last year, times a growth rate. On two and a
half years of a real chain's sales, that rule is 10.09% wrong on the
total. This is why, and what to do instead.
Checking a forecast once tells you almost nothing, so this one was checked 49 times. So this one is checked 49 times. The method sees history up to a point, forecasts the next six weeks, then the real numbers arrive and the error is measured. The whole thing rolls forward a week and repeats. Eleven methods went
through that mill, from a spreadsheet rule to a daily gradient
boosting model. The most valuable thing found was not a model. It
was a broken comparison.
What I did+
Built a rolling test across 49 weeks including four December
weeks, with every horizon scored on the same target weeks, so a
one-week-ahead number and a six-week-ahead number are compared
on identical targets.
Diagnosed why the standard rule fails rather than only
measuring that it fails. It compares to a week that is often not
comparable, and the fix needs no model and no new data.
Ran eleven methods on the same 254,898 forecasts each: napkin
rules, calendar corrections, Fourier regression, Theta,
exponential smoothing, and gradient boosting on both weeks and
days.
Measured the ceiling by letting a forecaster cheat with
information nobody could have, so the study can say when to stop
spending rather than only what to try next.
Reproduced the published competition approach on the same
data, on the same terms, and reported where it wins and where
its scoring rewards the wrong days.
Finished with an actual forecast for the two months after the
file ends, with a range built from the method's own measured
misses and the one assumption that moves it named on the
page.
Chapter 01
The test comes before the methods
Most forecast comparisons are decided by the test, not the model. A
single window flatters whichever method happens to suit that stretch
of calendar. So the design is fixed first and every method is poured
through the same pipe.
01
No method sees data from after its forecast date
The method learns from history up to a point in time, forecasts six
weeks, and only then are the real numbers revealed. Then everything
moves forward one week and repeats.
train ≤ t · forecast t+1 … t+6 · score · t = t+1
02
Weeks, because finance plans in weeks
Days are added up into weeks ending Sunday. A week counts only if
all seven days are present, which leaves 133 complete weeks and 867
shops with a full history.
133 complete weeks × 867 complete shops
03
December is in the test, on purpose
49 target weeks, from 24 August 2014 to 26 July 2015, four of them
in December. Leaving Christmas out would flatter every method in the test.
254,898 forecasts per method
04
Scored two ways, because they rank the methods differently
Average error as a share of sales. Predict 100, sell 93, that is 7%
wrong. Measured per shop, and on the chain total, which is the
number that reaches the board pack.
error = Σ |forecast − actual| ÷ Σ actual
Distance into the future is not the problem. The same-week-last-year
rule scores 10.10% one week ahead and 10.10% six weeks ahead. Completely
flat. Whatever is going wrong has nothing to do with how far out you are
looking, which rules out a whole family of explanations before any model
is fitted.
Chapter 02
The comparison week is often the wrong week
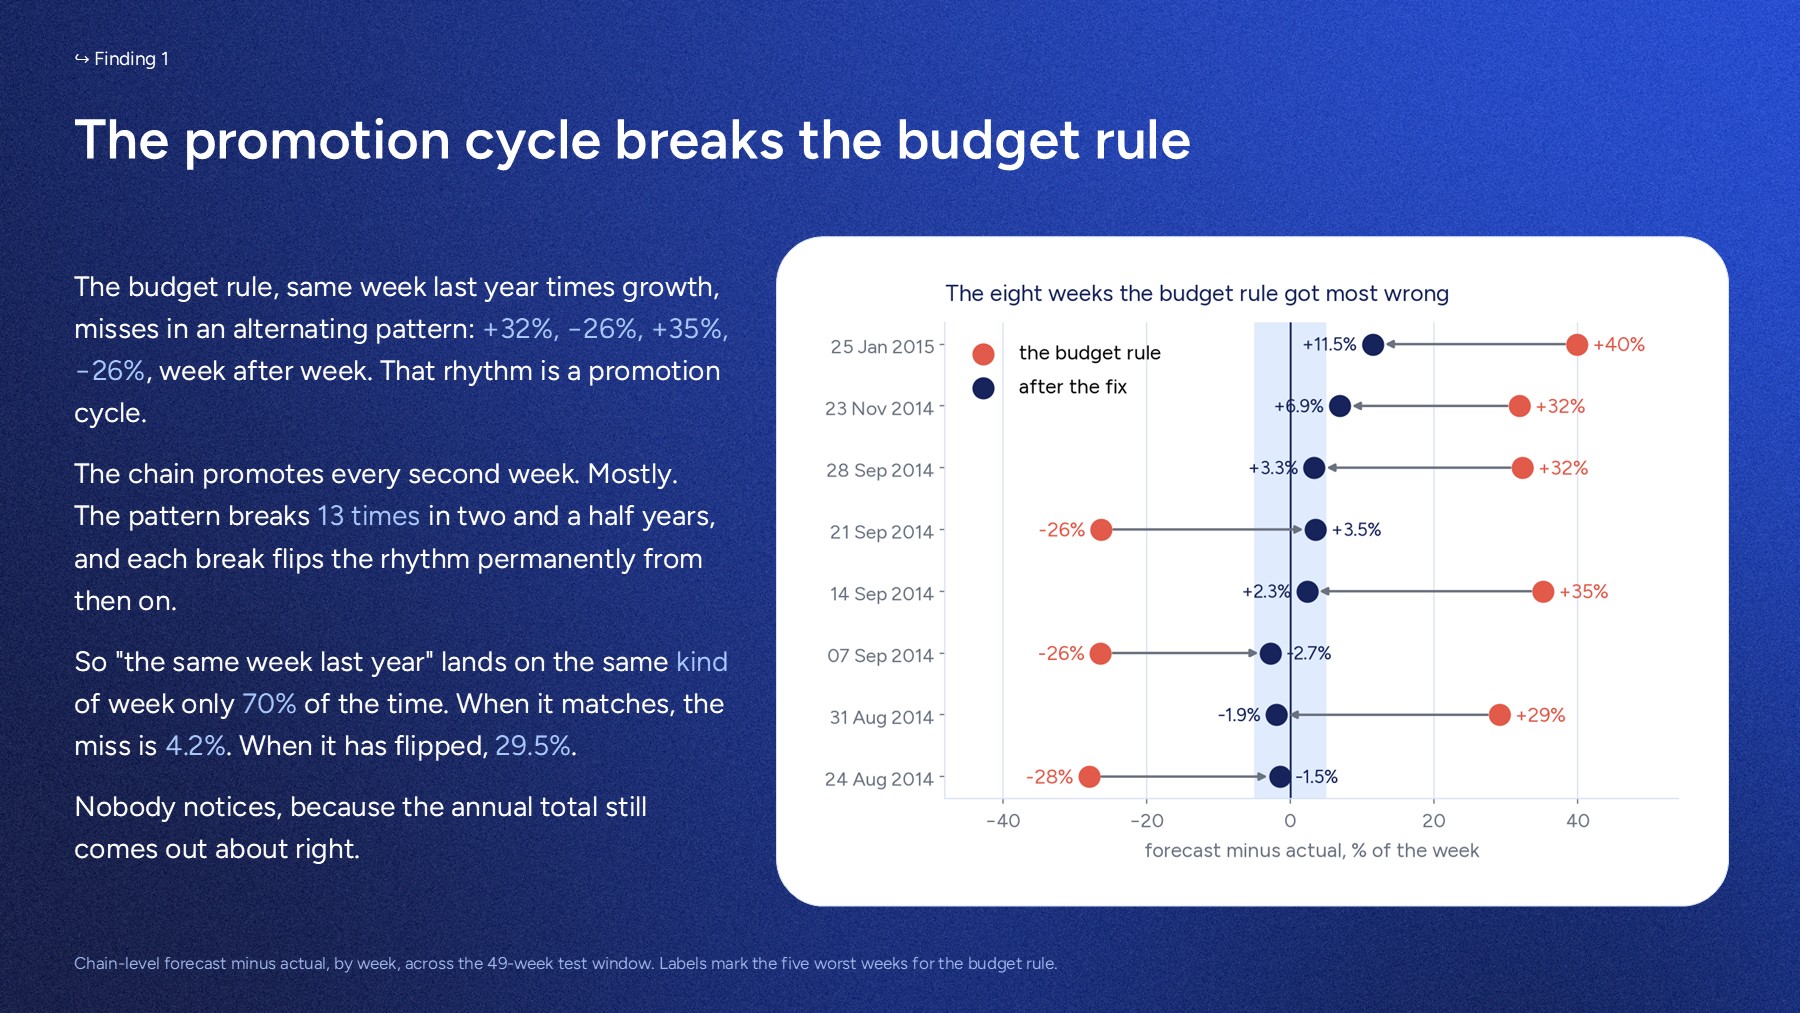
The budget rule's errors alternate: plus 32%, minus 26%, plus 35%,
minus 26%, week after week. That rhythm is not noise. It is a
promotion cycle, and it is the single most valuable finding in the
study.
The eight weeks it got most wrong, before and after.
25 January 2015 goes from +39.9% to +3.8%. 14 September 2014 from
+35.2% to 0.0%. 24 August 2014 from −28.0% to +2.9%. The correction
leaves the other weeks alone, which is what a correction should
do.
The chain promotes every second week. Mostly.
The alternating pattern breaks 13 times
across two and a half years, with two promotion weeks back to back
or two quiet weeks back to back. Each break flips the rhythm
permanently from that point on.
So "the same week last year" lands on the same
kind of week only 70% of the time. When it matches,
the miss is 4.2%. When it has flipped, 29.5%.
Nobody notices. The annual total still comes out
about right, so the error hides inside the year and only shows up
when someone is asked to explain a single bad week.
The fix costs nothing
Stop comparing to the calendar week.
Compare to the nearest week around this time last year that had
the same promotion status. A company already knows its own
promotion plan, so there is nothing to buy and nothing to
build.
It moves the comparison week on 16 of the 49
target weeks, and promotion status then matches on
49 of 49. Chain error falls from 10.09% to
4.19%.
Then the rest of the calendar. School and public
holidays get the same treatment, per shop, because German states run
different dates. On the 23 weeks whose calendar differs from last year, the miss falls again, from 4.60% to 3.76%, and nothing on the 26 weeks
where it matches.
Chapter 03
Eleven methods, and two numbers for each
The same forecast scores differently depending on what you add up,
and the gap is not a rounding error. It decides which method you
should pick.
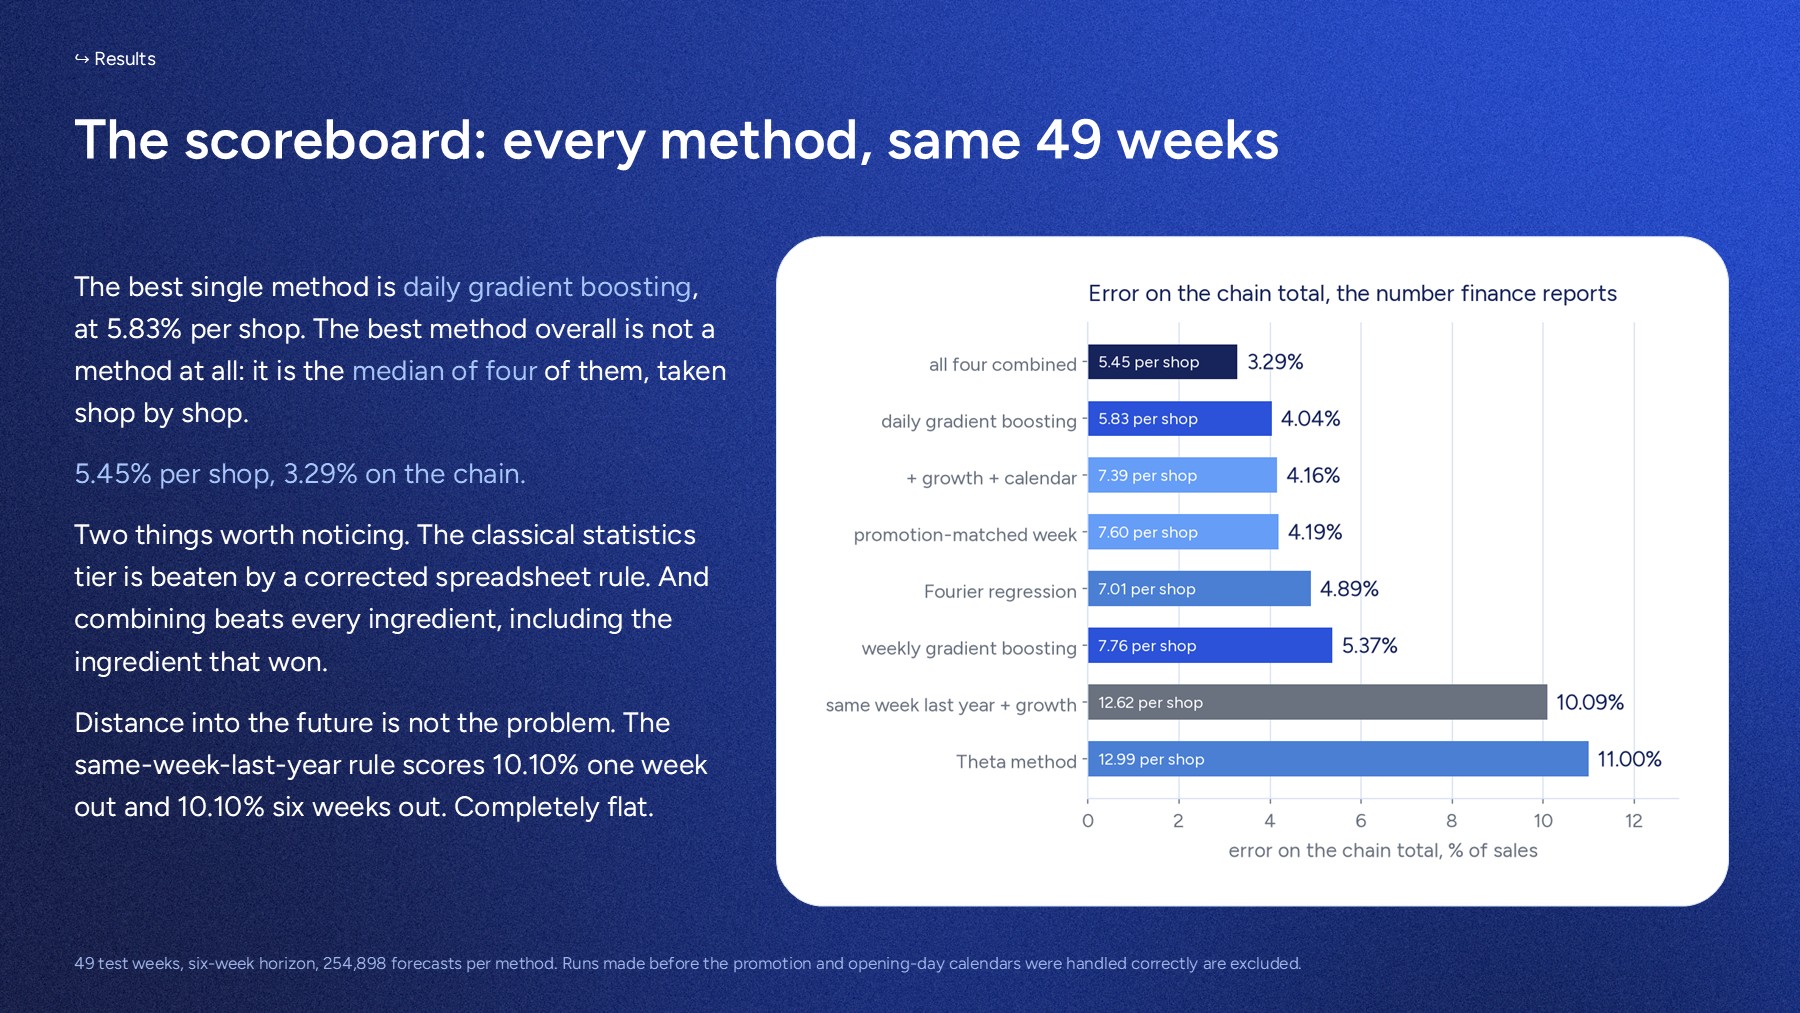
The best result came from combining four methods, not from picking one. It is the median of
four of them, taken shop by shop and week by week: the corrected rule,
a Fourier regression, Theta, and a daily gradient boosting model. The combination beats each of the four on its own, including the best of them.
Why the total beats the parts
Forecast three shops at 100. They come
in at 106, 94 and 100. Per shop you were 4% wrong. On the total
you were exactly right. The mistakes cancelled.
With 867 real shops that happens less perfectly,
but it happens: 5.45% per shop becomes 3.29% on the
chain.
A budget built shop by shop and summed is more accurate
than any shop's line in it. Worth saying out loud to anyone being
held to a shop-level target.
Picking the wrong one picks the wrong method
The weekly boosting model is better per
shop than the corrected rule, and worse on the chain. Its errors
lean the same way across shops, so they add up instead of
cancelling.
Choose the method on the number you actually
report. The budget is a chain total.
And the machine learning model came fourth. The
corrected spreadsheet rule reaches 4.16% on its own, and a finance
team can read it, argue with it and sign it.
Chapter 04
What failed, and how good anyone could ever be
A method chapter that reports no failures is not describing real
work. Four things were tried properly and did not earn a place, and
one measurement says when to stop trying.
Seasonal smoothing could not be fitted at all
It needs two full yearly cycles and there are only one and a half.
That is not a quirk of this file. Every company with under two years of history is in the same position, so it is reported as a result
rather than quietly dropped.
Theta was the worst of the serious methods
11.00% on the chain, and 23.01% in December. It has no way to know
about promotions or holidays, so it smooths straight through exactly
the weeks that decide whether anyone trusts a forecast.
The trading-day correction over-corrects
A lost opening day costs 89% of a day, not 100%, because a public
holiday moves demand rather than deleting it. Applied bluntly it
repairs three weeks and breaks three others.
Reconciliation stopped earning its keep
Taking the chain total from the rule and the shop split from the
model was the best trick available while the rule was broken. Once
the rule was fixed a plain median beat it, 3.29% against 4.06%. Fix
the input and the workaround is no longer needed.
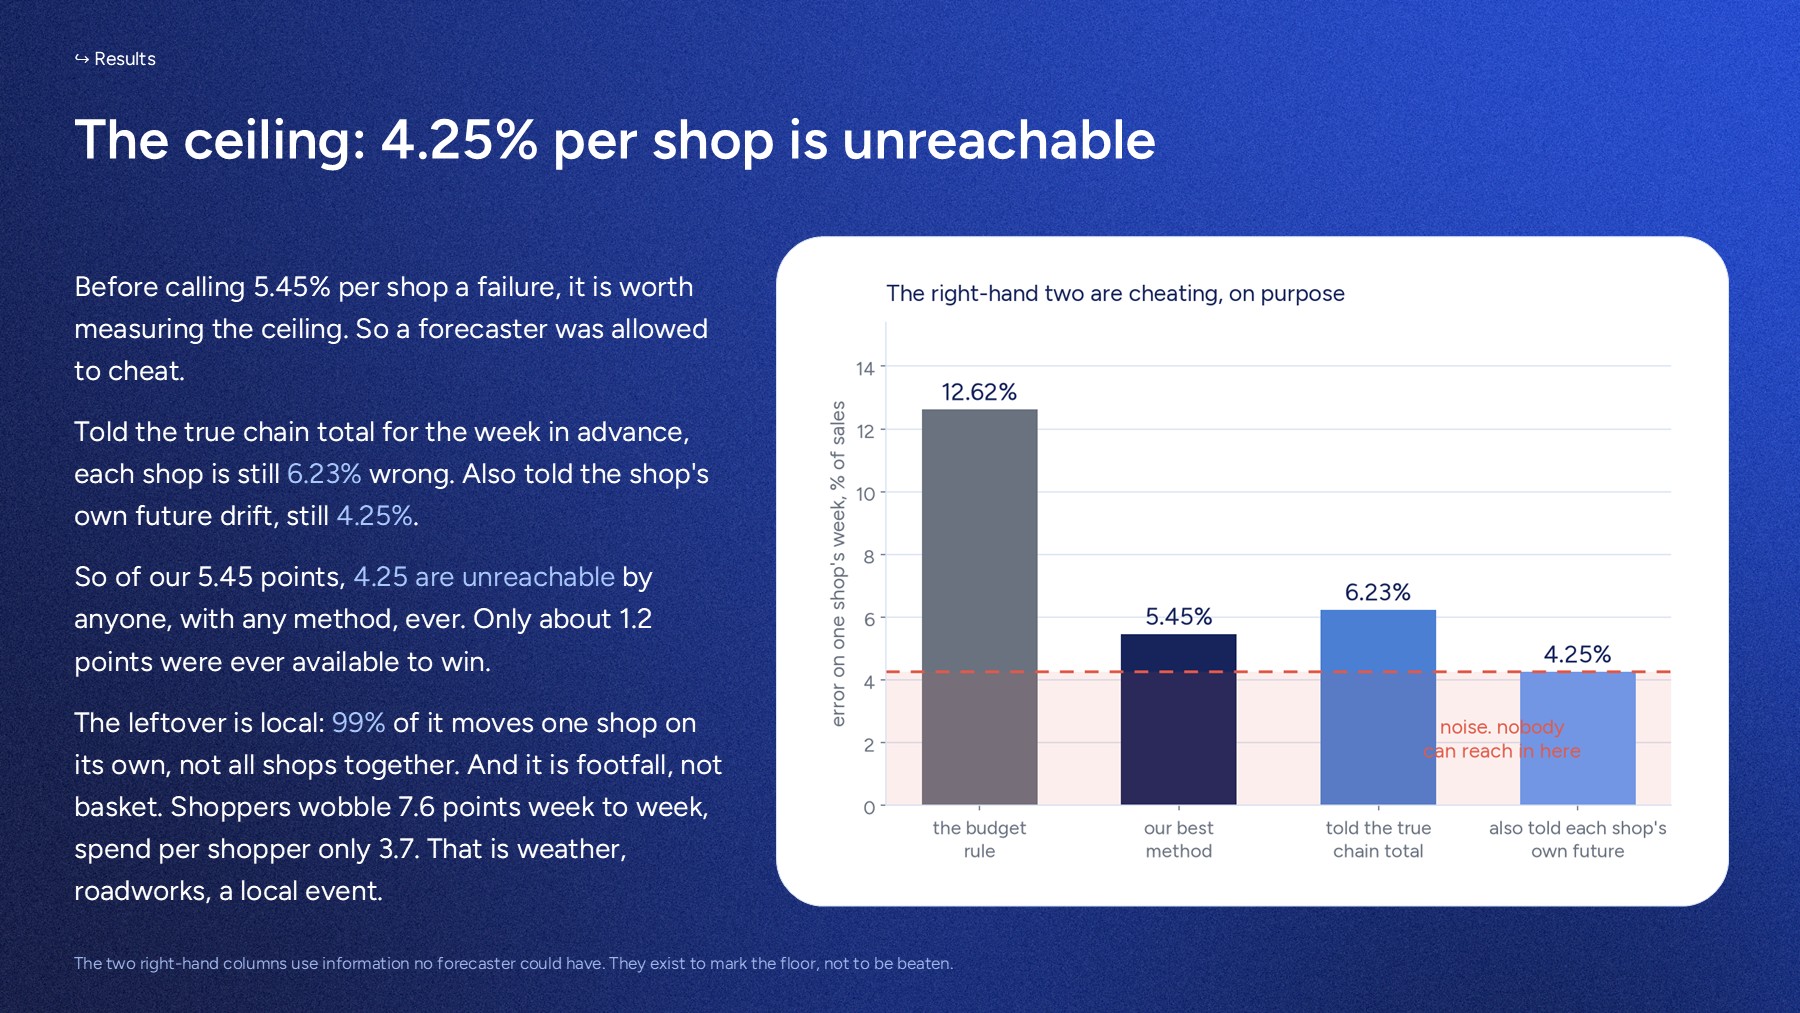
Then the ceiling, measured by cheating. Told the true
chain total for the week in advance, each shop is still 6.23% wrong.
Also told the shop's own future drift, still 4.25%. So of our 5.45
points, 4.25 are unreachable by anyone with any method. Only about 1.2
points were ever available to win.
The leftover is local, and it is footfall. 99% of the remaining
wobble moves one shop on its own rather than all shops together, and
shoppers vary 7.6 points week to week against 3.7 for spend per shopper.
That is weather, roadworks and a local event. No method can see any of
it, which is the honest reason to stop spending.
Chapter 05
Then forecast weeks that have not happened
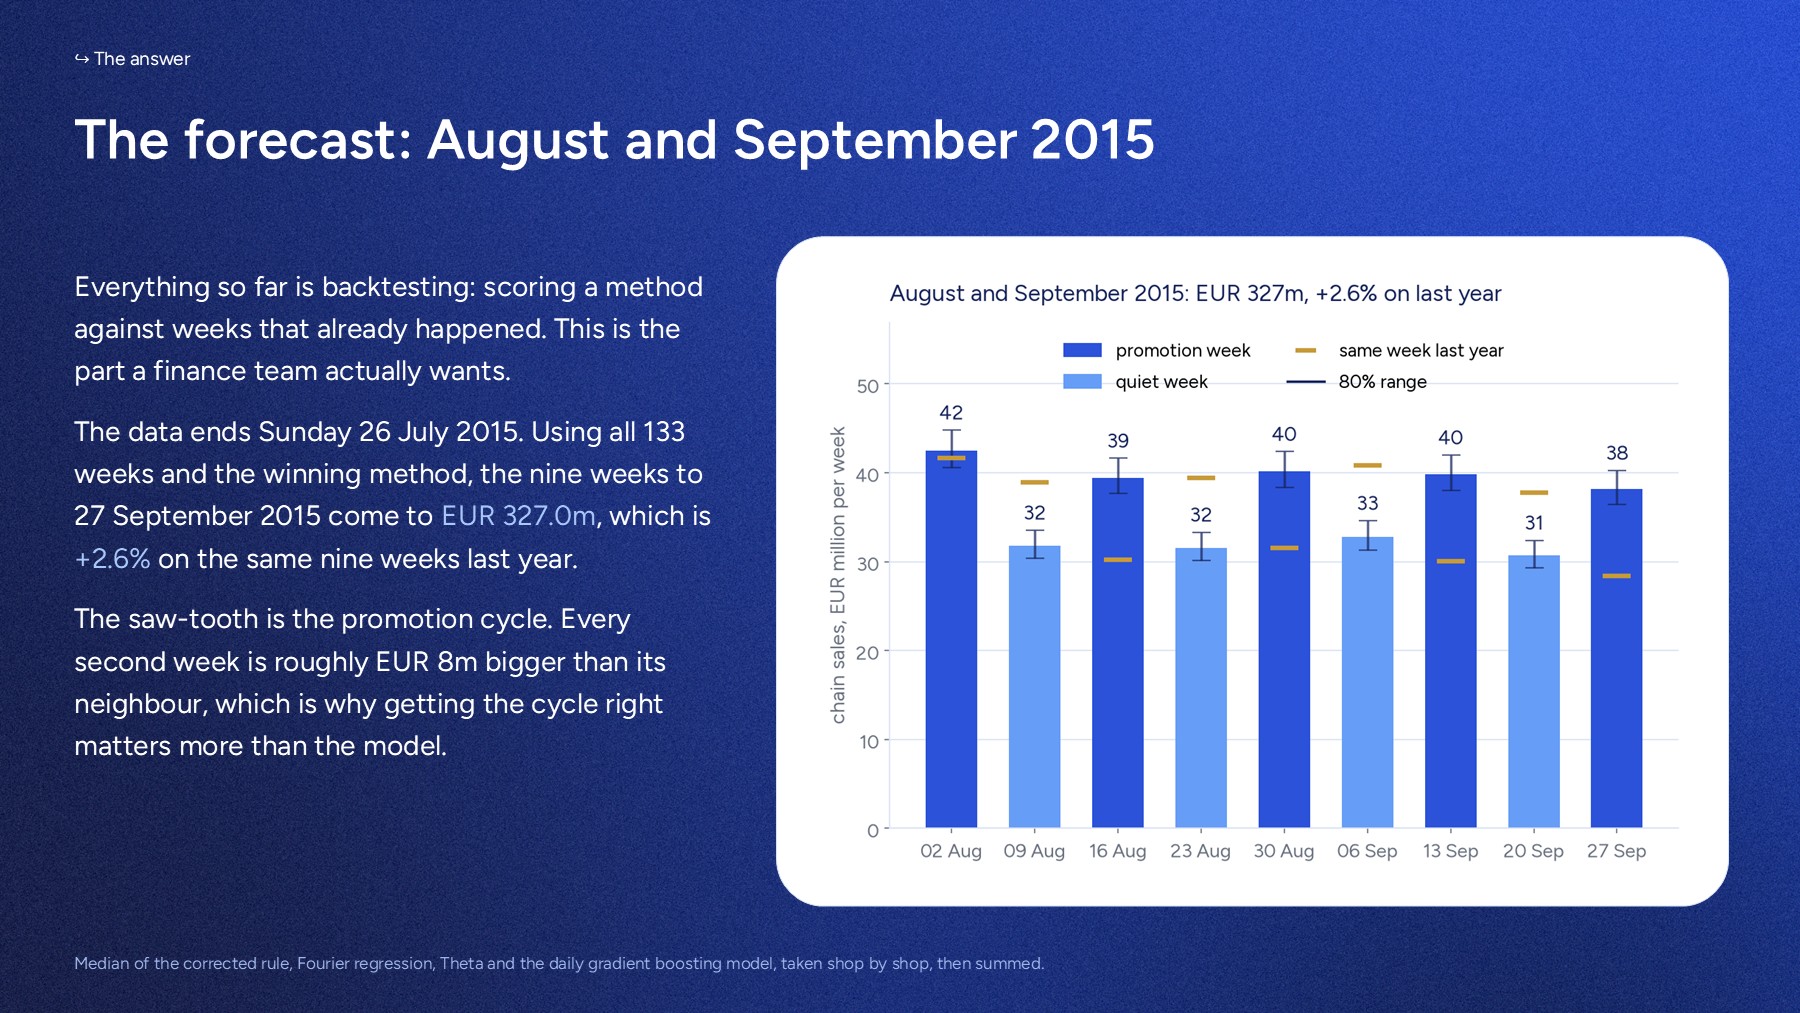
Everything above is backtesting, which is scoring a method against
weeks that already happened. This is the part a finance team actually
wants, and it is where the assumptions have to be named.
EUR 327.0m for August and September 2015, which is
+2.6% on the same nine weeks last year. The alternation between the
bars is the promotion cycle: every second week is roughly EUR 8m
bigger than its neighbour, which is why getting the cycle right
matters more than getting the model right.
The range is measured, not invented
A single number with no range does not tell you how wrong it could be. This one is built from how this exact method
actually missed across its own 49 test weeks.
80% range on the nine-week total:
EUR 312.3m to EUR 345.0m, or −2.0% to +8.2% against last
year.
Checked, not assumed. An interval that has been
measured against real misses is worth more than a point estimate
that has not.
The one assumption that matters
The forecast assumes the fortnightly
promotion cycle continues. A real company does not assume this, it
reads its own promotion plan.
If the cycle lands the other way the answer
moves by EUR 9.6m, or 2.9%. That is larger than the gap
between the best method and the third best, which is the whole
argument in one number.
Holidays and opening days for the forecast weeks
are taken from the same week one year earlier, per shop, and that is
stated on the slide rather than buried in an appendix.
Chapter 06
What this cannot tell you
Stated here rather than left to be found.
Two and a half years is short
One and a half yearly cycles of training is enough to find the
promotion problem and to rank methods, and not enough to fit a
seasonal model or to separate a trend from a two-year wave. The
study says which conclusions depend on that and which do not.
A forecast is not a plan
It says what the number is likely to be if nothing is done
differently. It cannot price a decision, and it cannot tell you
whether a promotion week was worth running. That is the promotion
study, which is the point of running them together.
The promotion calendar was mine to assume
The forward forecast extends the observed fortnightly cycle,
because the real plan is not in a public file. A client supplies
theirs and that assumption disappears. It is shown with the cycle
flipped so the reader can see exactly what it is worth.
Reflection
What this study taught me
1. Diagnose the failure before replacing the method.
The instinct is to answer a bad forecast with a better model. Six
of the seven points recovered here came from noticing that "the same
week last year" had stopped meaning the same kind of week. That fix
needs no model, no new data and no new system, and it would have
been invisible to anyone who went straight to fitting.
2. Score the number you actually report.
Per shop and on the chain total, methods rank differently, because
independent errors cancel upward and correlated ones do not. An accuracy figure means nothing until you say what it was measured on: one store, or the chain total.
3. Measure the ceiling, so you know when to stop.
Letting a forecaster cheat with information nobody could have shows
that 4.25 of the remaining 5.45 points are noise. Most accuracy
projects have no such number, which is why they never finish. The
most useful thing an analyst can say is sometimes that the remaining
gap is not worth buying.
4. Check the setup before believing the result.
Twice in this study a result looked decisive and was an artefact of how I had configured the test. Once a training leak that flattered a model by 2.6 points, once a model handicapped to under a year of history so it had never seen a Christmas. Both were caught because
the number was too good or too bad to be plausible. Implausibility
is a signal, and it is worth acting on before publication rather
than after.
Interested in what your data can support?
Start with the question, not a proposal. If your export
cannot support the study you had in mind, that is worth knowing in
twenty minutes.
Ask what your data can support
No system access, no IT project, one export
Signed engagement letter and data processing agreement