A grocery chain can raise prices, or it can
keep volume. Nobody in the business could say which products would
survive a rise, because nobody had measured what a price move actually
costs in volume. I measured it product by product and store by store,
then turned each answer into the one number a finance director can act
on: how much volume that product's own margin can afford to lose.
What I did+
Built the estimator: every store-product-week as its own cell,
each store-product and each week gets its own adjustment, so a permanently dearer store and a chain-wide price move are both removed before the price effect is measured.
Separated the list-price response from the promotional one, then
split the promotion again into the discount and the merchandising
that travels with it. About 44% of a "promotion effect" turns out
to be the display and the leaflet.
Turned every elasticity into a margin threshold, so each move is
pre-cleared against the volume it can afford to lose rather than
argued about afterwards.
Designed the store test: six products at +5% in 38 matched
stores for eight weeks, an automatic revert, and one product frozen
at its old price as a sentinel.
Wrote the falsification programme: eight competing explanations
tested and eliminated, three attempted repairs abandoned and
documented rather than buried.
Chapter 01
Here is what the study answers
Three questions, in the order a finance director asks them. Which
prices can move. By how much, before the volume loss costs more than the
rise earns. And how do we find out cheaply that we were wrong, instead of expensively?
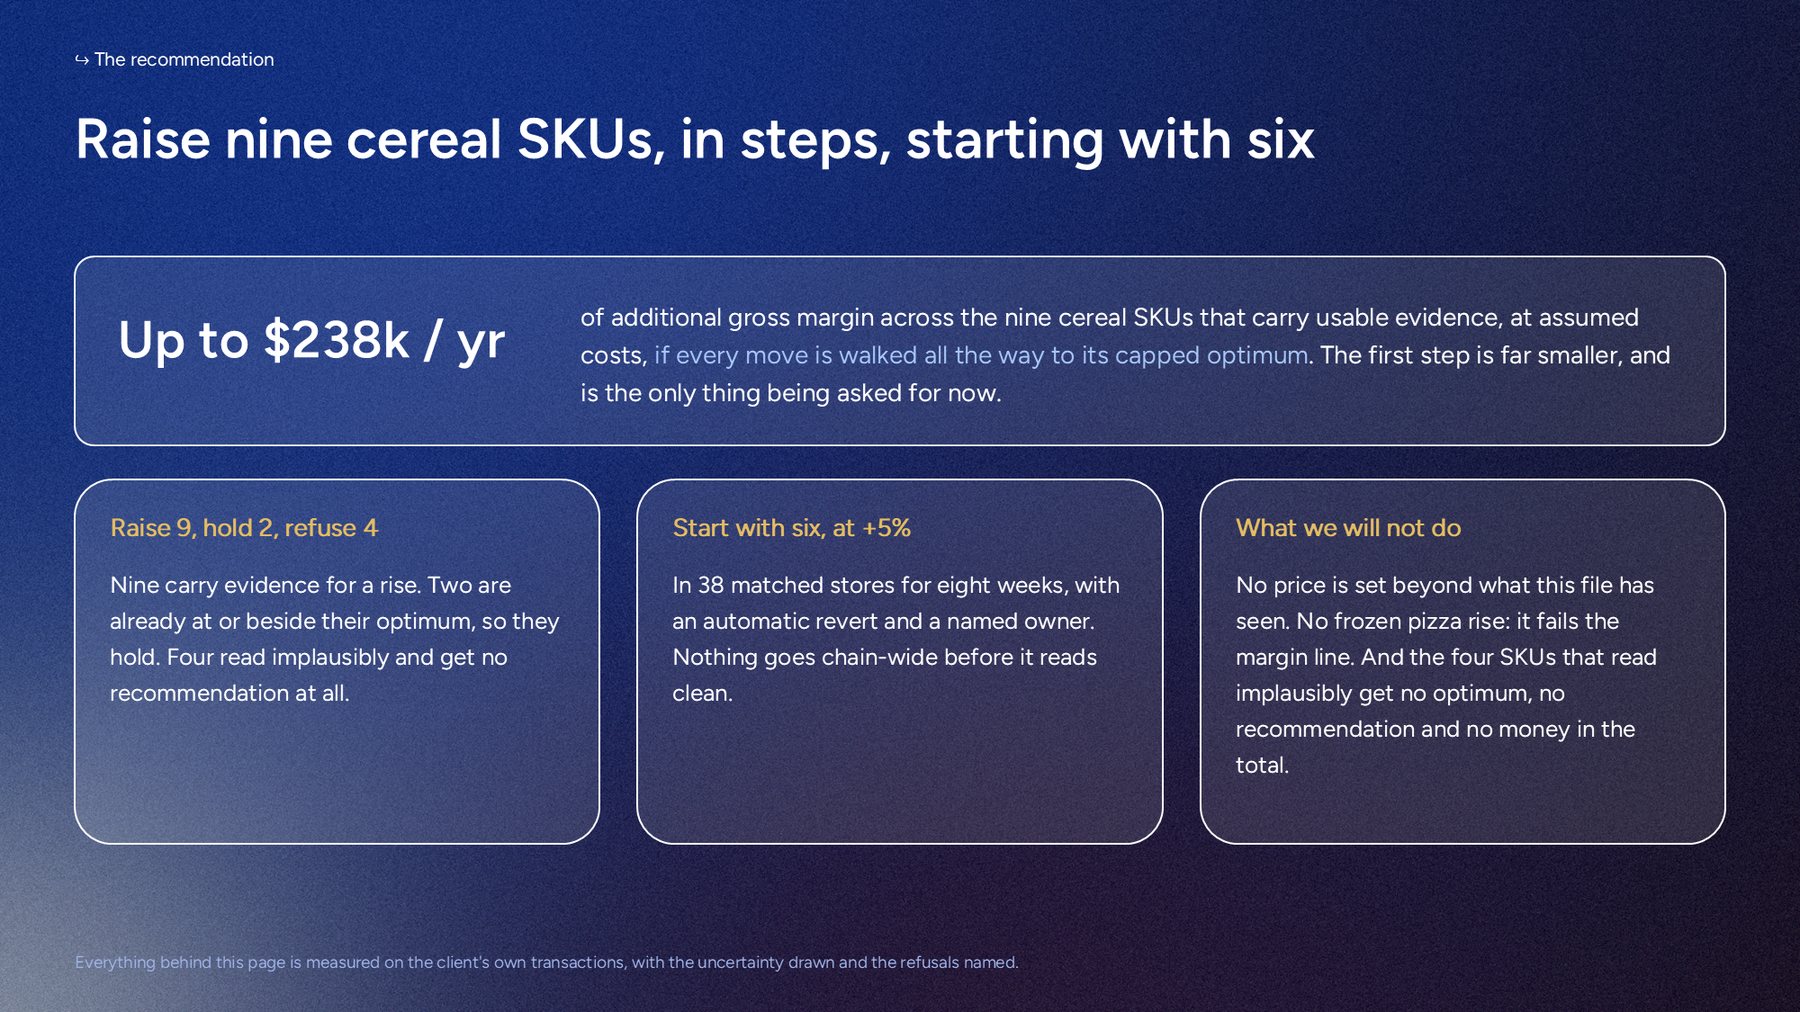
The answer on one page. Nine products carry evidence
for a rise, two hold, four get no recommendation at all.
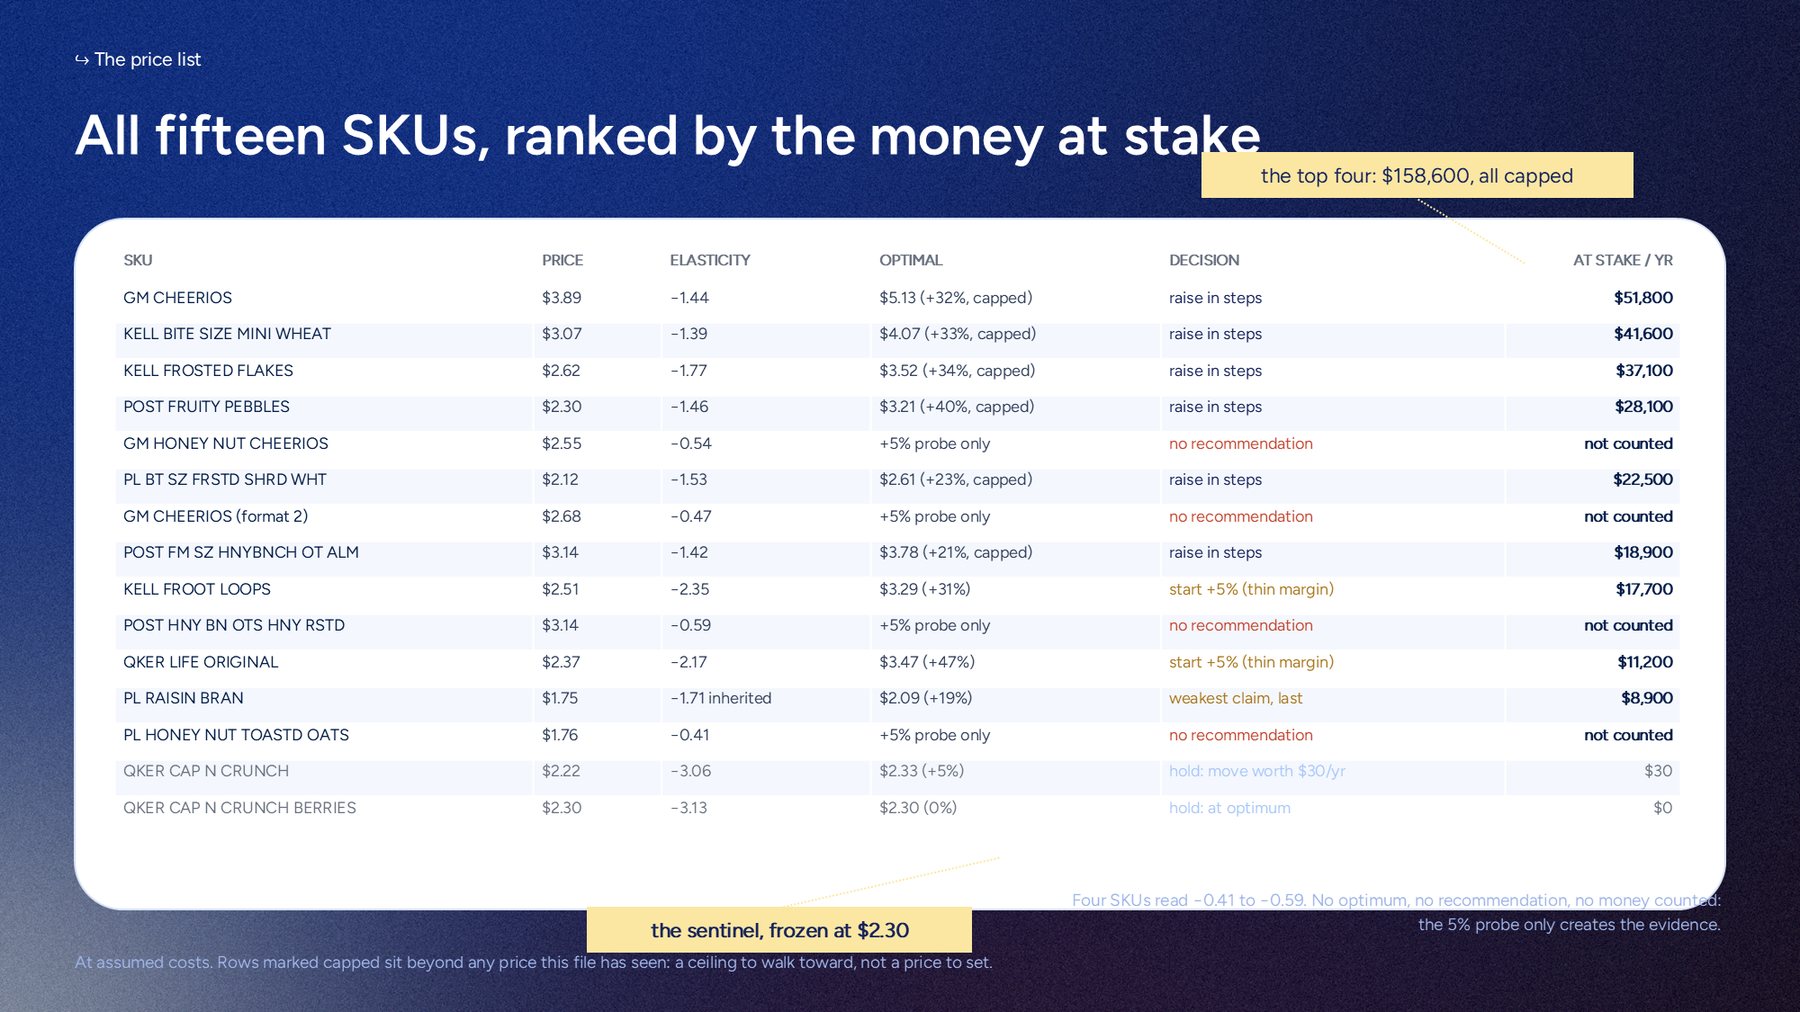
Every product, with its reason. Price, elasticity,
optimum, decision and money, one row each, colour-coded by how strong
the evidence behind it is.
Chapter 02
The hardest question this study gets
Prices are never set at random. They are raised into strong demand and
discounted into weak, which is exactly the thing that makes a naive
elasticity worthless. So the first question is not what the number is.
It is where the number comes from.
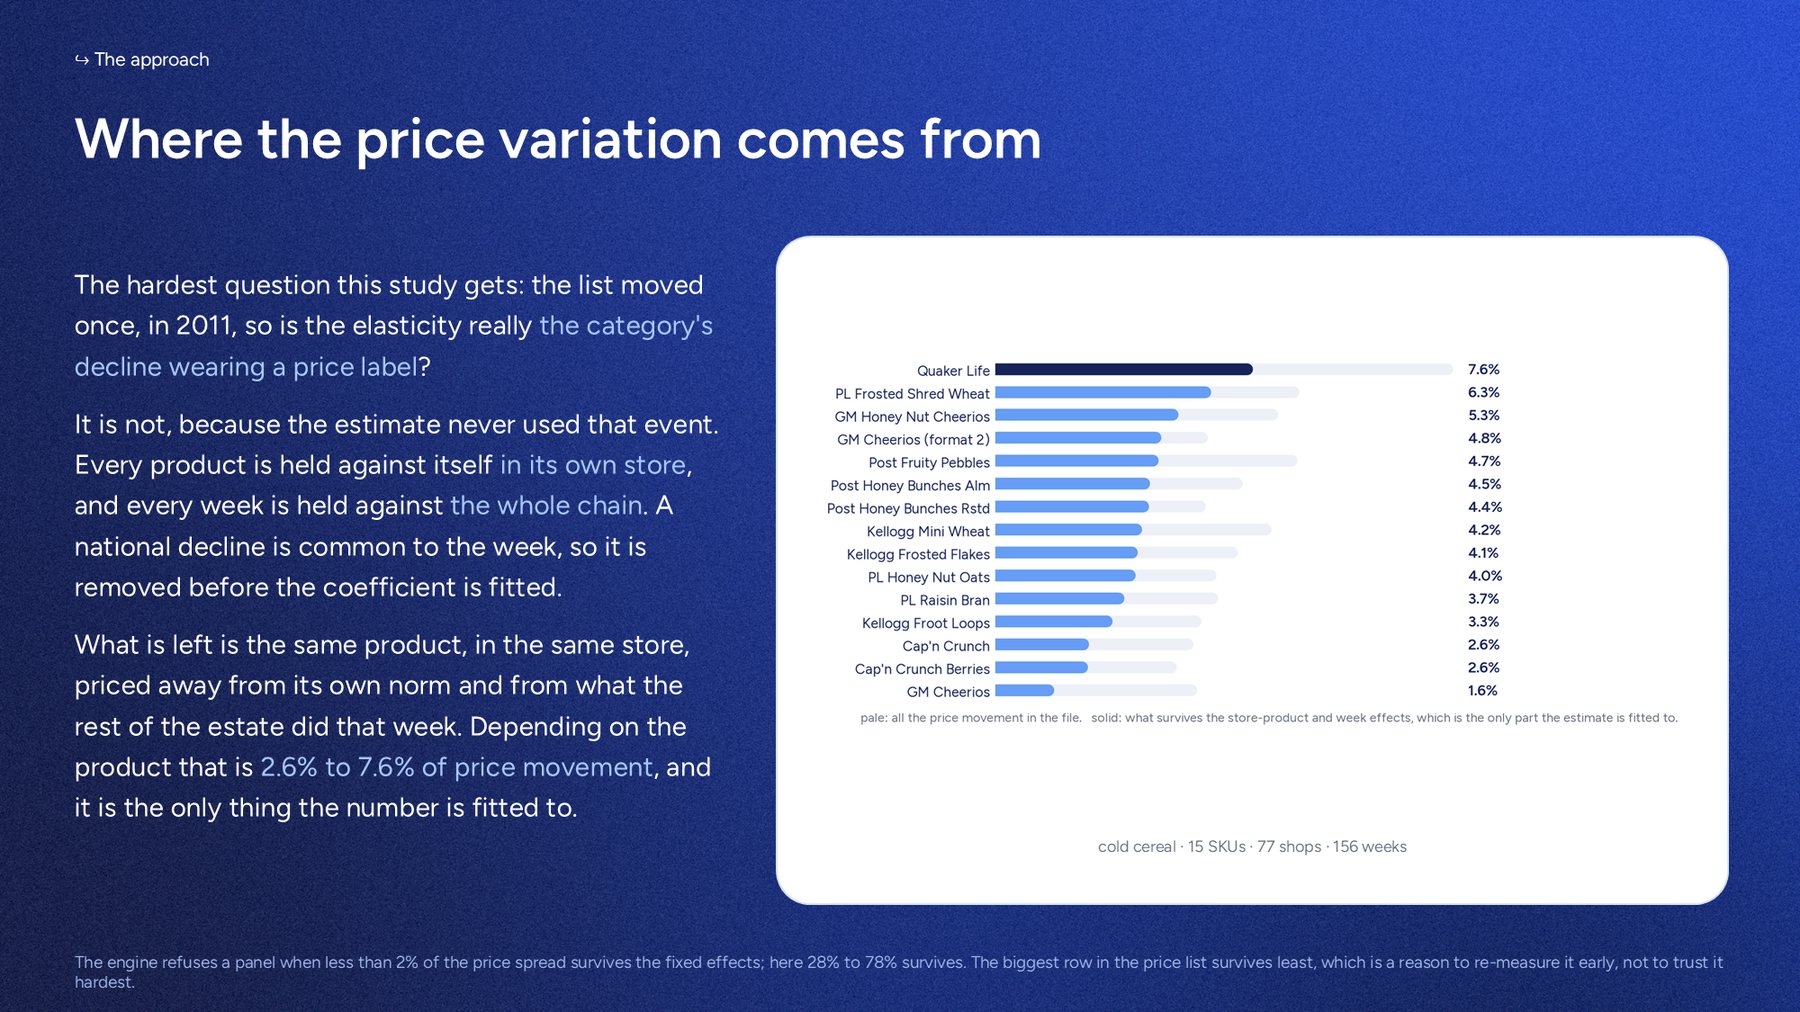
What the estimate is actually fitted to. Everything
permanent about a product in a store is removed, and so is everything
common to a week. What survives is the same product, in the same store,
priced away from its own norm and from what the rest of the estate did
that week: between 2.6% and 7.6% of price movement, depending on the
product.
What this still cannot prove. That the surviving variation is free
of local demand. The standard statistical repair for this was tried and did not work here: the outside price signal it relies on only carries the chain-wide move, which has already been removed. The study says so on the page rather than
claiming an identification it does not have, and the answer is the store test, not a more confident claim.
Chapter 03
Three levels of evidence, not one column of prices
A hundred products each carrying a recommended price reads as more work
and less evidence. Every product here lands in one of three levels, and
the level decides what may be done with it.
Level 1 · Strong evidence
8 products · $200,030
What qualifies. A precise estimate, sitting clear of the margin
line, on enough price movement to trust it.
What happens. Act on it. Raise in steps, or hold where the
price is already at its optimum.
Level 2 · Test only
3 products · $37,800
What qualifies. The direction is supported but the size is not:
a margin too thin to carry the loss, or an estimate inherited from the
category rather than measured on the product.
What happens. Move 5% and re-measure before anything
larger.
Level 3 · No recommendation
4 products · $0 claimed
What qualifies. The estimate reads between −0.41 and −0.59,
which no cereal sustains. The number is not usable, and a precise wrong
number is worse than a missing one.
What happens. No price is recommended, and none of their money
is in the headline.
Those four products would be worth $64,500
at a 5% move. That figure sits deliberately outside the $238k, because a
number with no recommendation behind it does not belong in a total.
Chapter 04
What the answer does when the years change
An elasticity is not a constant. It moves with competition and with the
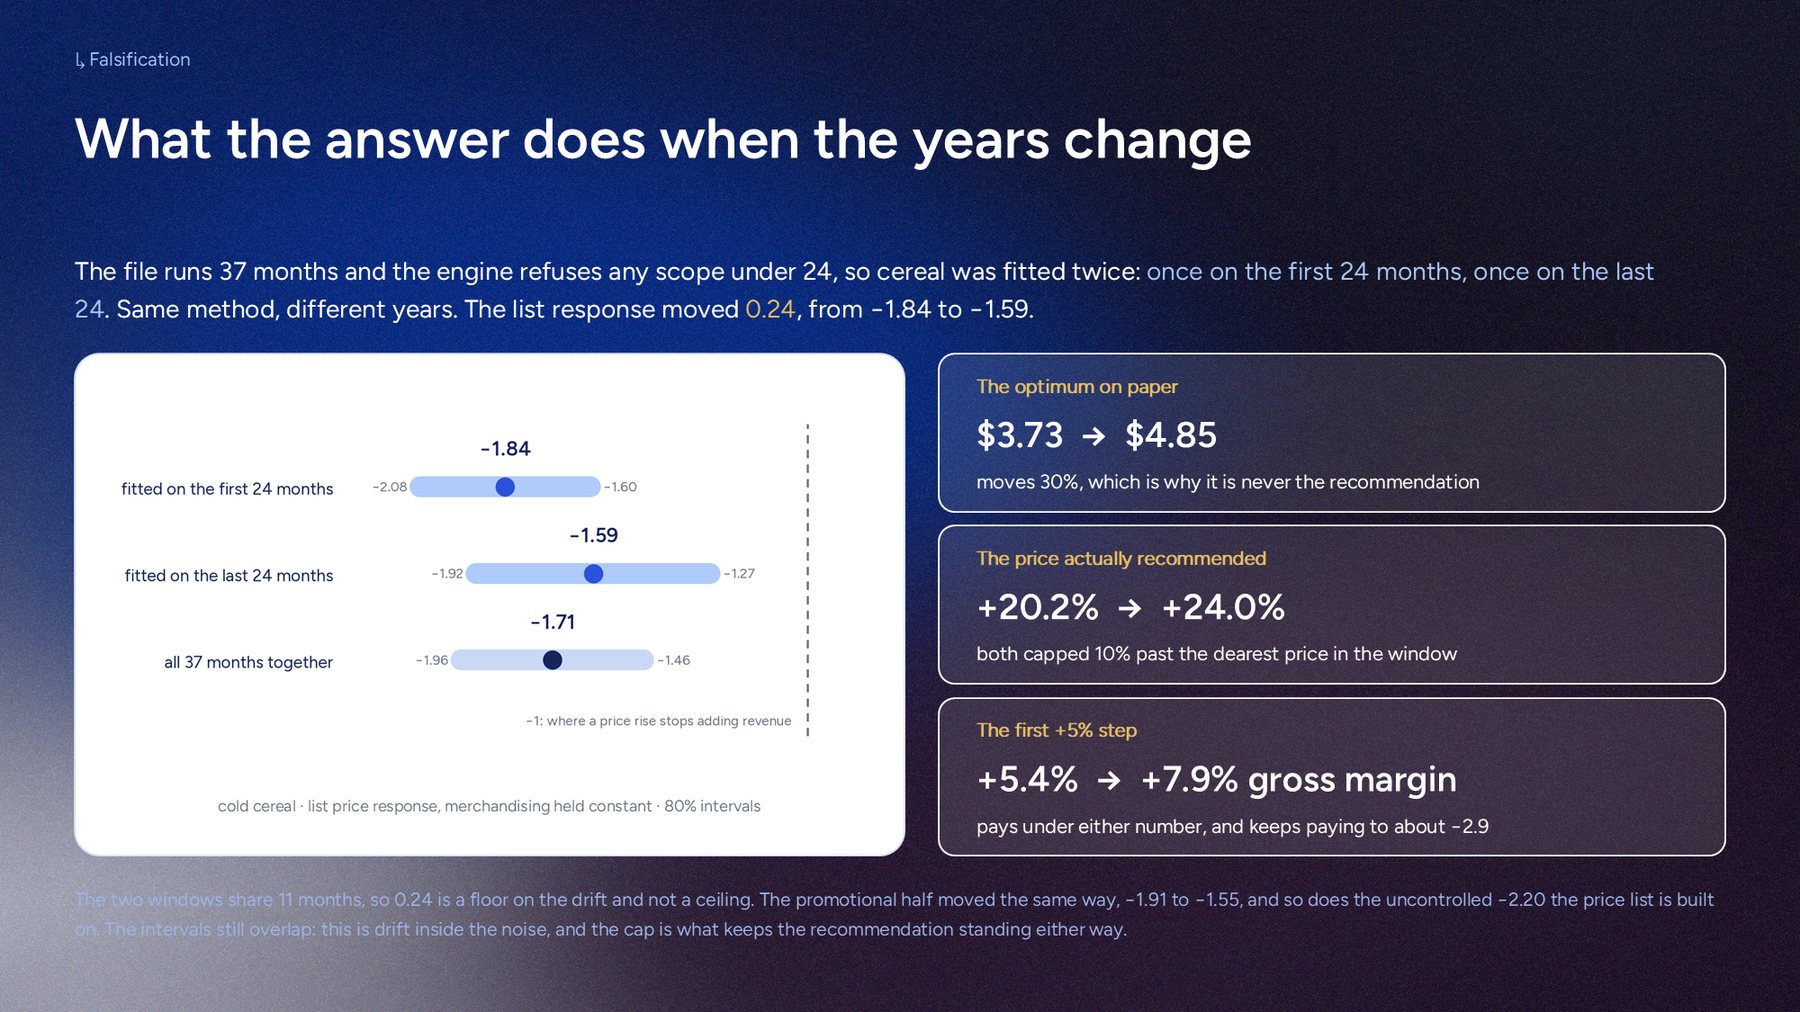
health of the category. So the category was fitted twice, on the first 24
months and on the last 24, and the difference was priced rather than
described.
The drift, and what it is worth. The list response moved
0.24. The optimum on paper moved 30%. The price actually recommended
moved less than four points, because it is capped just past the dearest
price the chain has charged.
Why the recommendation survives a moving coefficient. Because it is
anchored to prices the business has actually charged, not to the optimum.
The first +5% step adds margin under either estimate, and keeps paying
until the elasticity reaches about −2.9. That gap is the safety margin, and
it is computed before anything moves.
Chapter 05
Then it is tested, not assumed
No price goes chain-wide on a coefficient. The first move is small,
reversible, and designed to fail loudly if it is wrong.
01
38 matched pairs
Test stores read against controls of near-identical revenue. One pair
differs by 0.1%.
02
Everything else frozen
Same promotions, same displays, same shelf. A display week moves
volume up to 73% on its own, and one slipping in would corrupt the
read.
03
An automatic tripwire
Any product breaching its affordable-loss threshold two weeks running
reverts to its old price. That product only. No meeting.
04
A sentinel
One product stays at its old price everywhere. If it moves,
something other than our prices is moving the market, and the read is
flagged.
Chapter 06
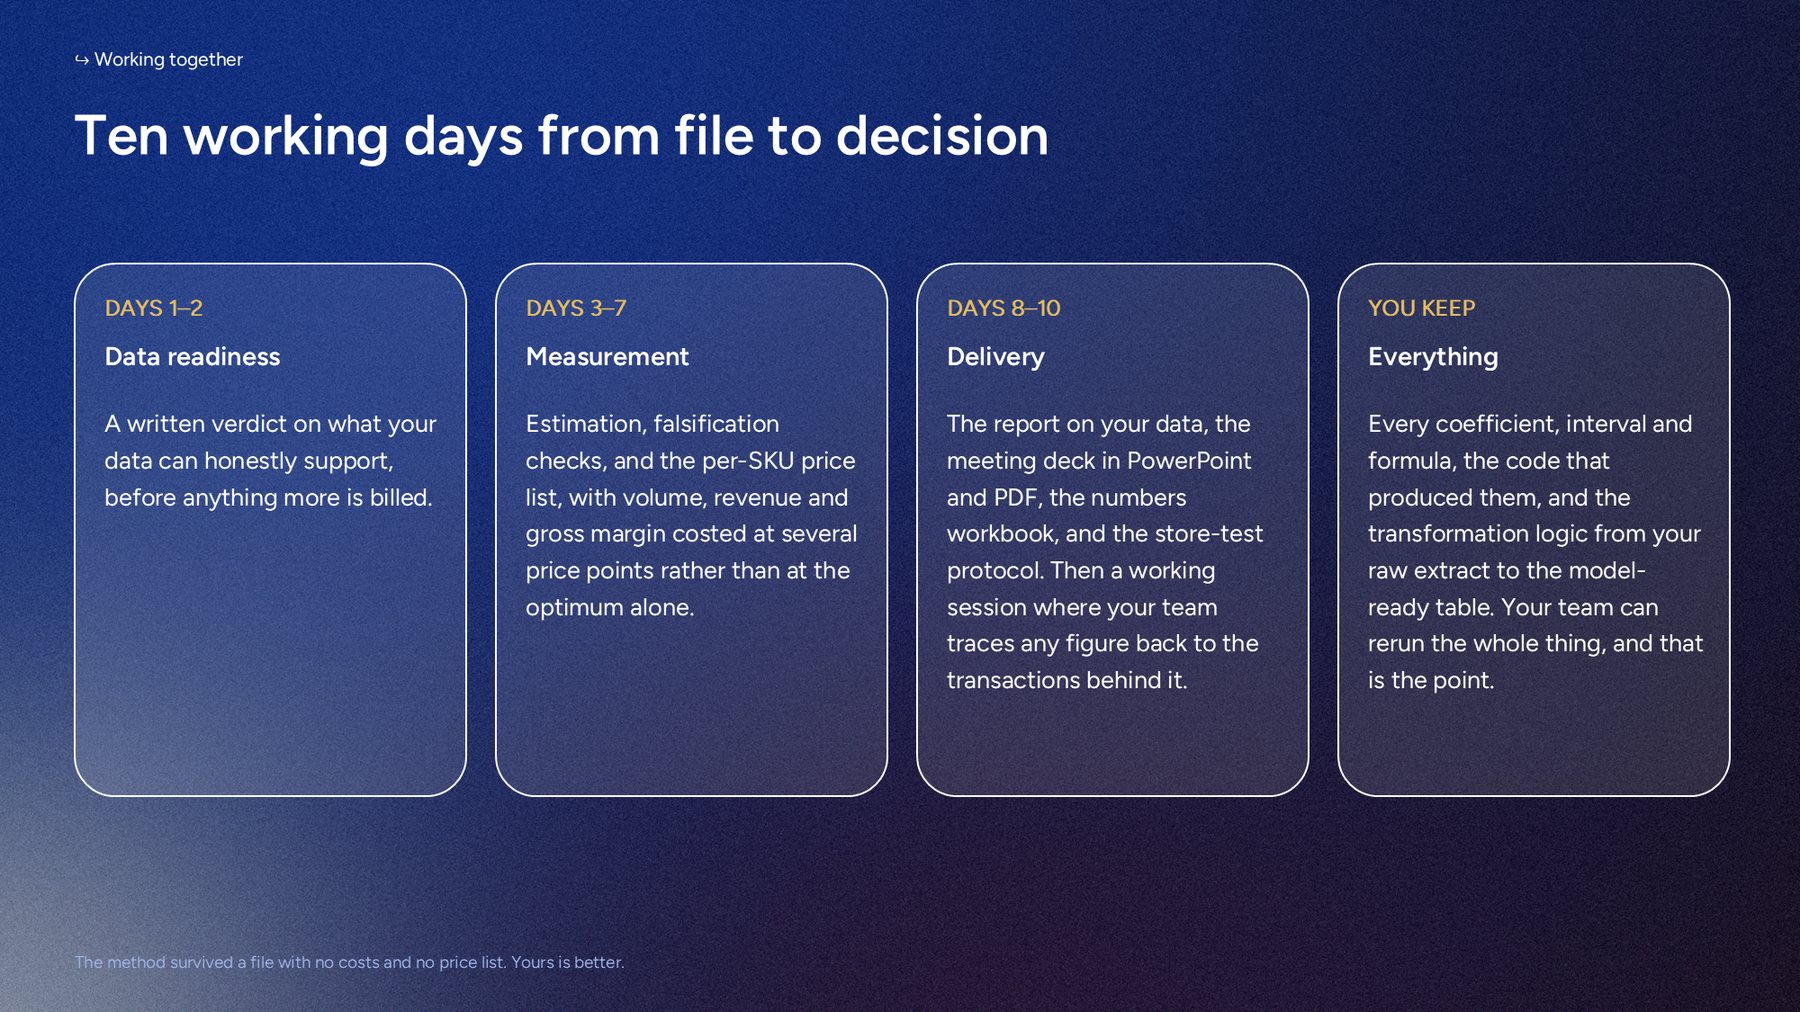
Ten working days, from one export to a decision
The same shape on a client file. Two days deciding whether the data can
honestly carry the study, before anything more is billed.
What you keep. Every coefficient, interval and formula,
the code that produced them, and the transformation logic from your raw
extract to the model-ready table. Your team can rerun the whole thing,
and that is the point.
Chapter 07
What this cannot tell you
Stated here rather than left to be found.
Costs are assumed
This public file carries none. Optimal prices and dollar figures
re-price the day real costs arrive. The price responses themselves do
not move.
Store switching is invisible
The data sees this chain only. If a whole category rises sharply, some
shoppers change store, which is part of why the moves are capped and
staged.
Price image is strategy
Cereal is a known-value aisle. Whether a flagship carries a +30%
optimum is a commercial decision this analysis informs but does not
make.
Reflection
What this study taught me
1. The refusal has to live in the arithmetic.
Four products were described as unmeasured in the text and their money
was still inside the headline, because the code computed a figure for
every row and the judgement lived in a footnote. Honesty written beside
a number is not honesty. It has to be enforced where the number is
produced, or it will not survive the next rollup.
2. Never quote the biggest number on its own.
The optimum, the first rung, and what sits between are three different
numbers. Quote one of them alone and you will be held to it in year
two. So all three appear together, every time, and the first one asked
for is always the smallest.
3. Where the price movement comes from is what the meeting is about.
Not the fit statistics, not the model choice, not the forecast accuracy. Where the
price variation comes from, and whether it is caused by the demand it
is supposed to explain. Everything else is downstream of that one
question, and it deserves its own page.
4. Capping the rise is what makes the answer hold.
An elasticity moves between years. A price anchored to what the
business has actually charged does not. Capping the recommendation
inside the observed range is what makes a moving coefficient survive
contact with a real price list.
Interested in what your data can support?
Start with the question, not a proposal. If your export
cannot support the study you had in mind, that is worth knowing in
twenty minutes.
Ask what your data can support
No system access, no IT project, one export
Signed engagement letter and data processing agreement