No shelf prices, no costs, no promotion flags.
The normal price was rebuilt from the history, proved against a second
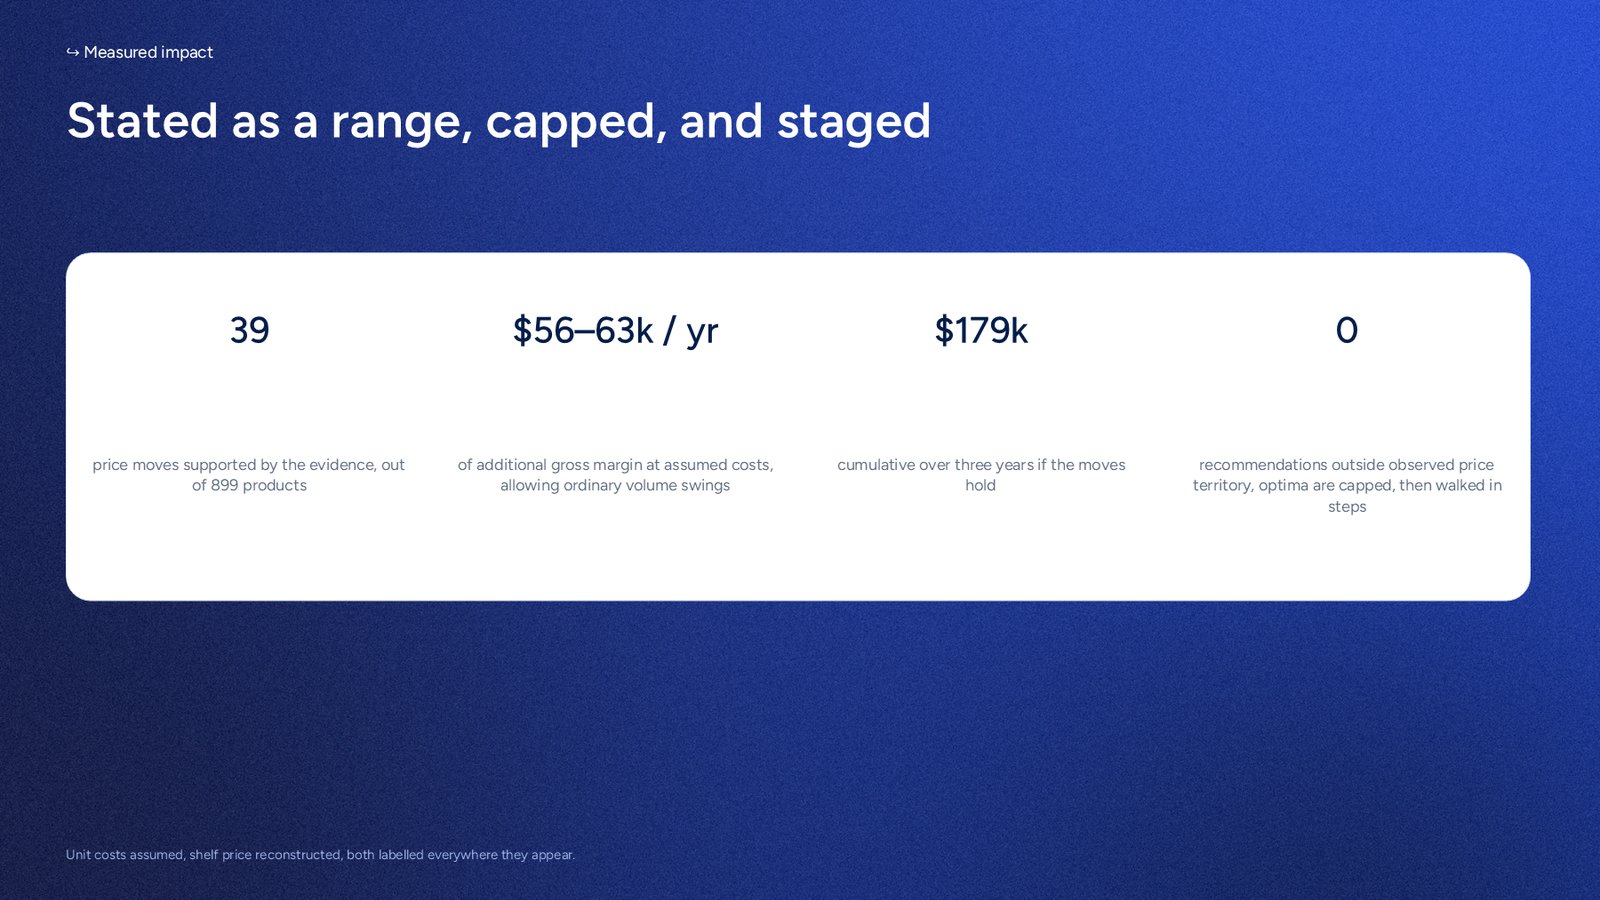
retailer, and only then used to price 39 moves.
Most client exports look like this one rather
than like a clean file. Receipts show what shoppers paid. They do not show
what the product normally costs, so there is no way to tell a promotion from an ordinary cheap week. Volume reacts very differently to each. Everything downstream depends on getting that one column back.
What I did+
Rebuilt the normal shelf price from each product-store's own price
history, rather than assuming the most common price, or the highest one, is the shelf price.
Validated it before using it: ran the same reconstruction against a
second public retailer whose file does record the true shelf price and
the real promotion flags, and measured how often it agreed.
Estimated price response product by product and store by store, with
displays and leaflet features controlled separately so merchandising is
not billed to price.
Quoted the prize as a range produced by ordinary year-to-year volume
swings, not as a single figure with false precision.
Capped every move near the price territory the product has actually
traded in, and staged the rest.
Chapter 01
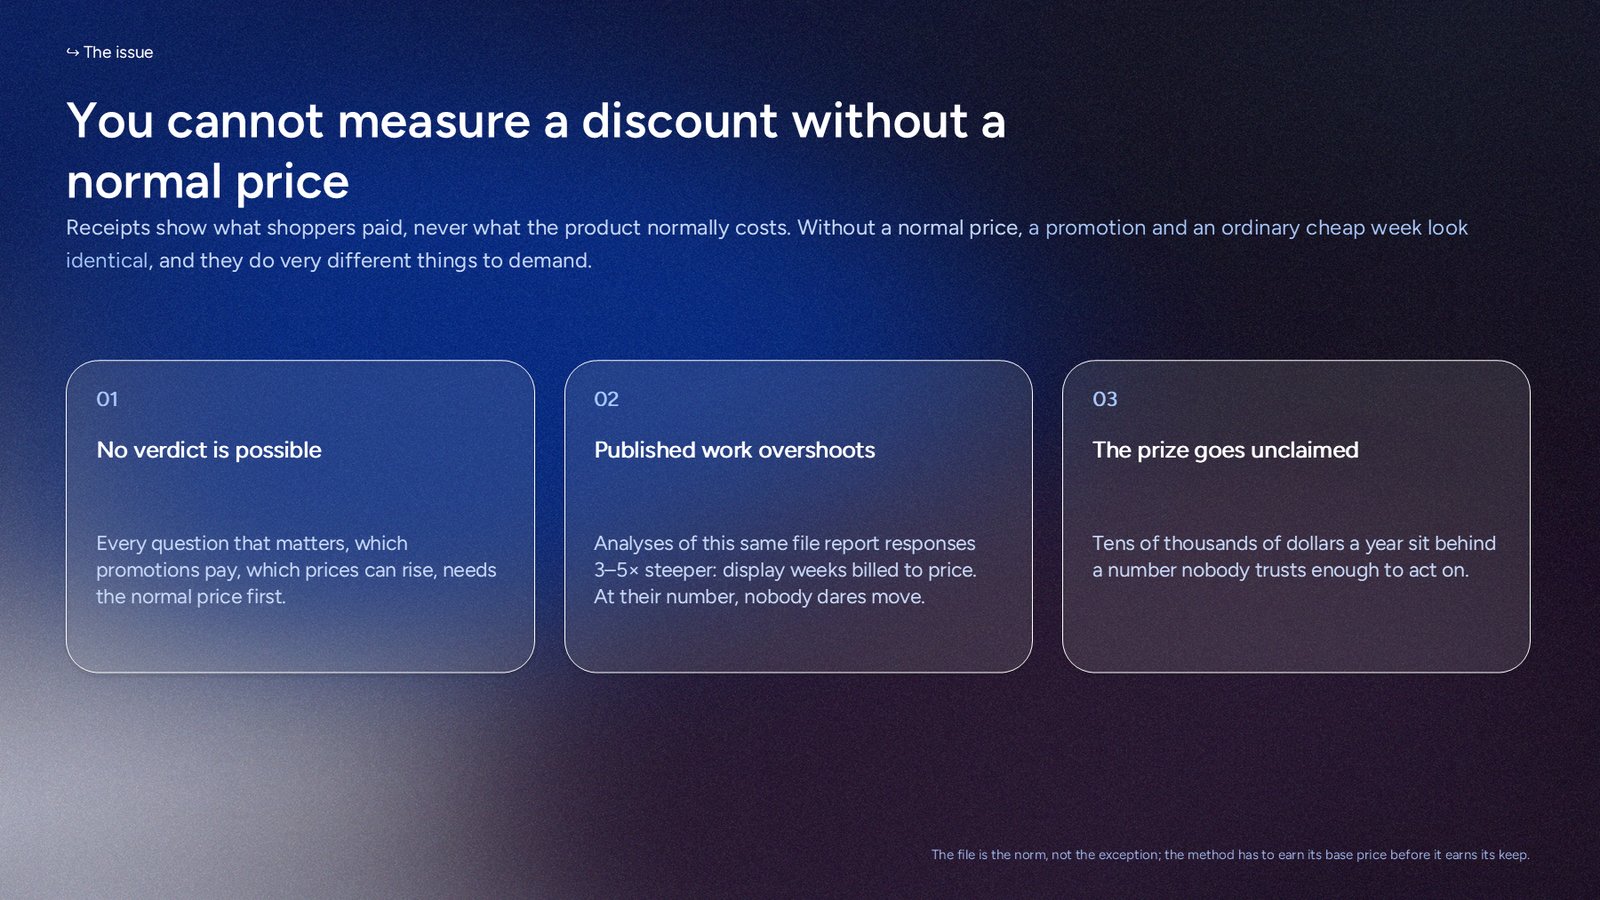
You cannot measure a discount without a normal price
A promotion and an ordinary cheap week look identical on a receipt, and they
do very different things to demand. Without the list price, every promotion
number downstream is guesswork.
The problem, stated plainly. The file records what was
paid, never what was asked.
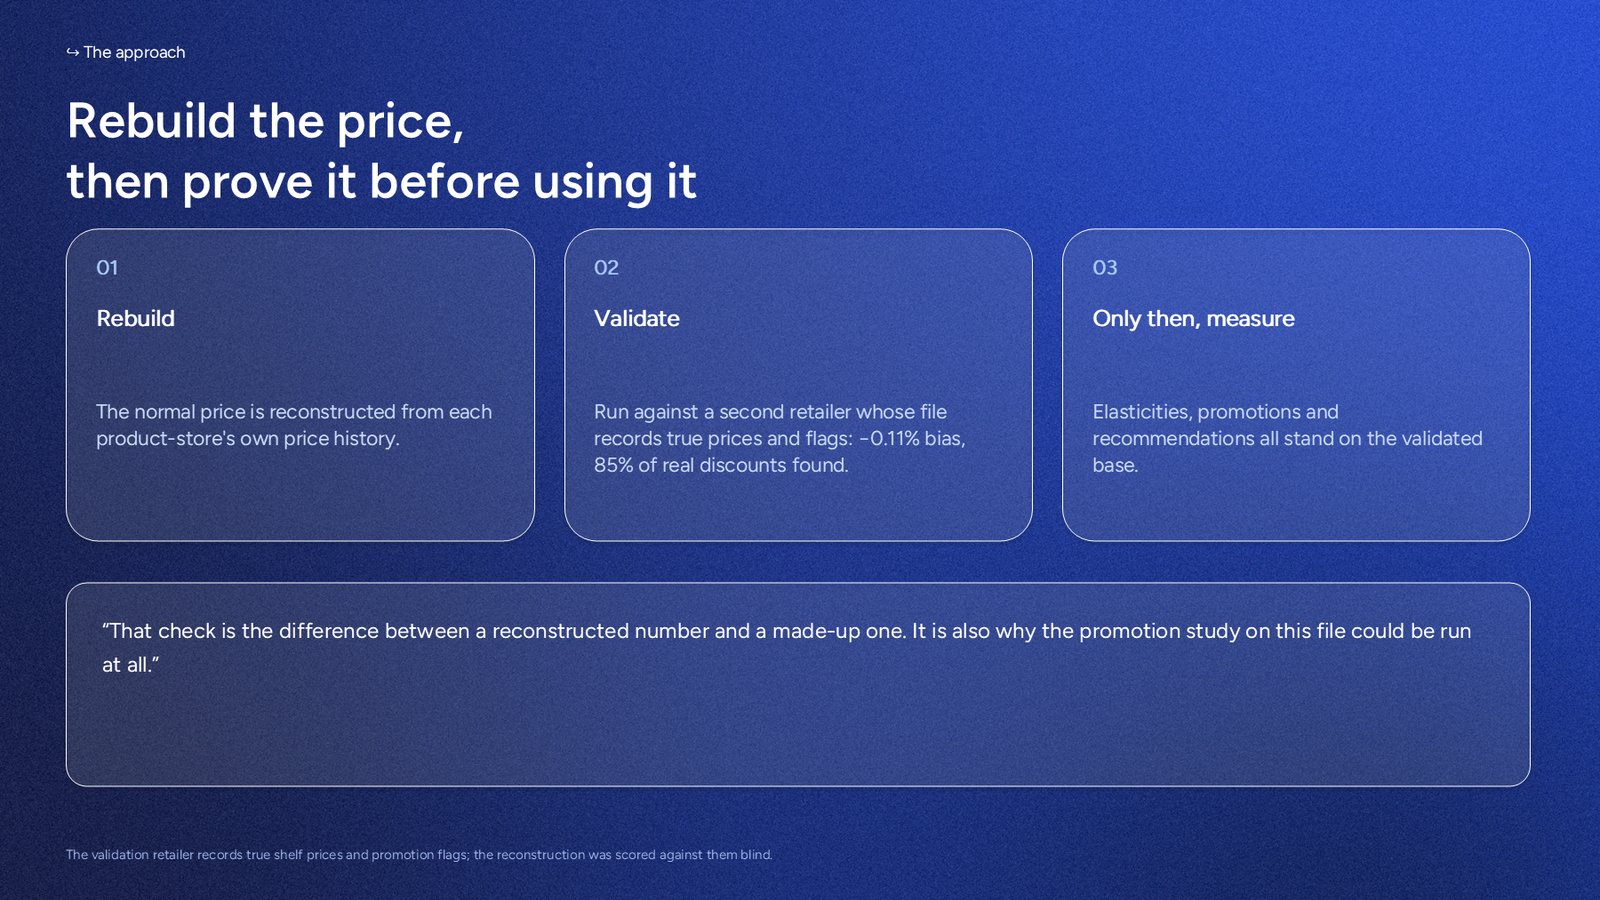
Rebuild the price, then check it. An unchecked reconstruction is still a guess, so it was run against a retailer whose true prices are recorded before it was used anywhere.
The check is the whole difference. Run against a second public retailer
whose file does carry the true shelf price, the reconstruction came back
0.11% below the truth on average and found 85% of the promotions that retailer
actually ran. That is also why the promotion study on this file could be run at
all.
Chapter 02
What price does to volume here
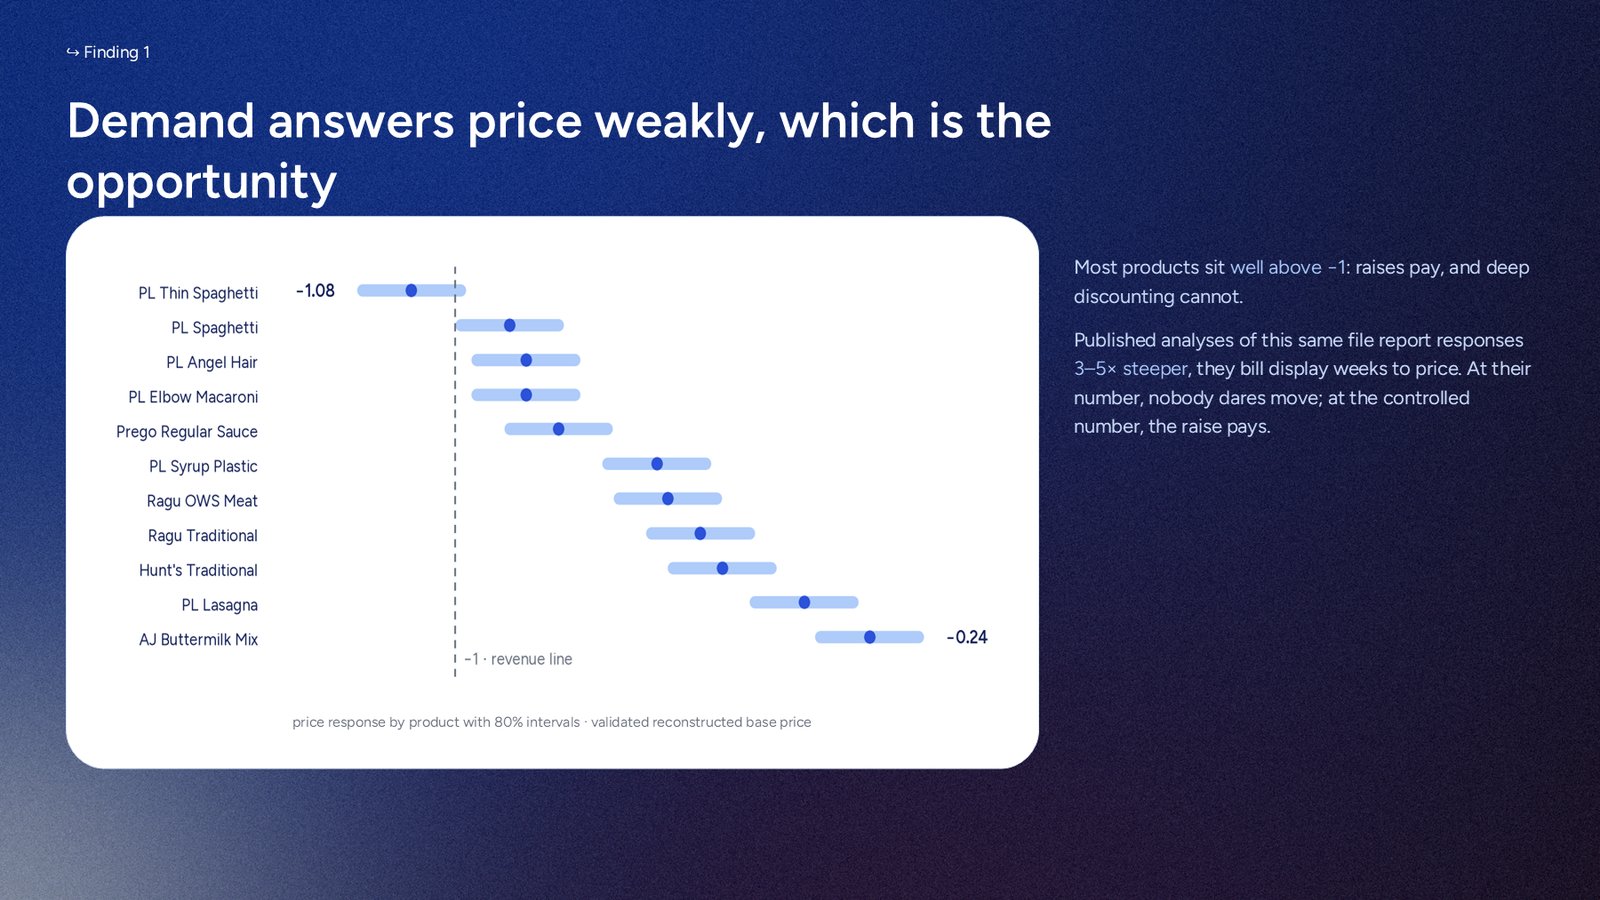
Volume here barely reacts to price. Most products sit well above −1,
which is why a raise can pay and why deep discounting cannot.
Measured product by product, each with its interval.
Published analyses of this same public file report responses three to five
times steeper.
Why the difference, and why it matters. The usual reason is that volume is compared to price without separating out the displays and leaflet features
running in the same weeks, so the merchandising effect gets charged to price.
The stakes are commercial, not academic: at the steeper number a 5% rise looks
like it would cost 14% of volume and nobody dares move. At the controlled
number it costs about 4%, and the raise pays.
Chapter 03
How the prize is stated
Three rules, all of which make the number smaller and none of which is
optional.
01
A range, not a single figure
Volume moves year to year for reasons that have nothing to do with price.
The prize is quoted as the range those ordinary swings produce.
02
Capped, not optimal
Where the arithmetic points far above any price the product has ever
carried, the move is capped near observed territory and walked in
steps.
03
Each move pre-cleared
Every recommendation carries the volume it should lose beside the volume
its own margin can afford to lose, both computed before anything
changes.
04
Two things are not the client's
The unit costs are an assumed model and the shelf price is reconstructed.
Both are labelled everywhere they appear.
$56k to $63k in a realistic year, at assumed costs, and
$179k over three years if the same moves hold. The band is drawn rather than
hidden.
Reflection
What this study taught me
1. Rebuilding the list price took most of the study.
Everything a client wants to know about promotions and pricing runs
through the list price, and it is the column most exports do not have.
2. A reconstruction is only worth what its validation is worth.
Anyone can infer a normal price. Running the same method against a
retailer whose truth is recorded, and reporting the bias and the hit rate,
is what separates it from a plausible guess. That test took longer than the
reconstruction did.
3. Controls change the decision, not just the coefficient.
Three to five times steeper is not an academic disagreement. It is the
difference between a business that dares to raise a price and one that does
not.
4. Say which numbers are not theirs.
Assumed costs and a reconstructed price are both legitimate. Quietly
mixing them in with measured figures is not. Labelling them everywhere
costs nothing and is the reason the rest gets believed.
Interested in what your data can support?
Start with the question, not a proposal. If your export cannot
support the study you had in mind, that is worth knowing in twenty
minutes.
Ask what your data can support
No system access, no IT project, one export
Signed engagement letter and data processing agreement